
IMAGE
Fig. 5
Image
|
Figure Caption
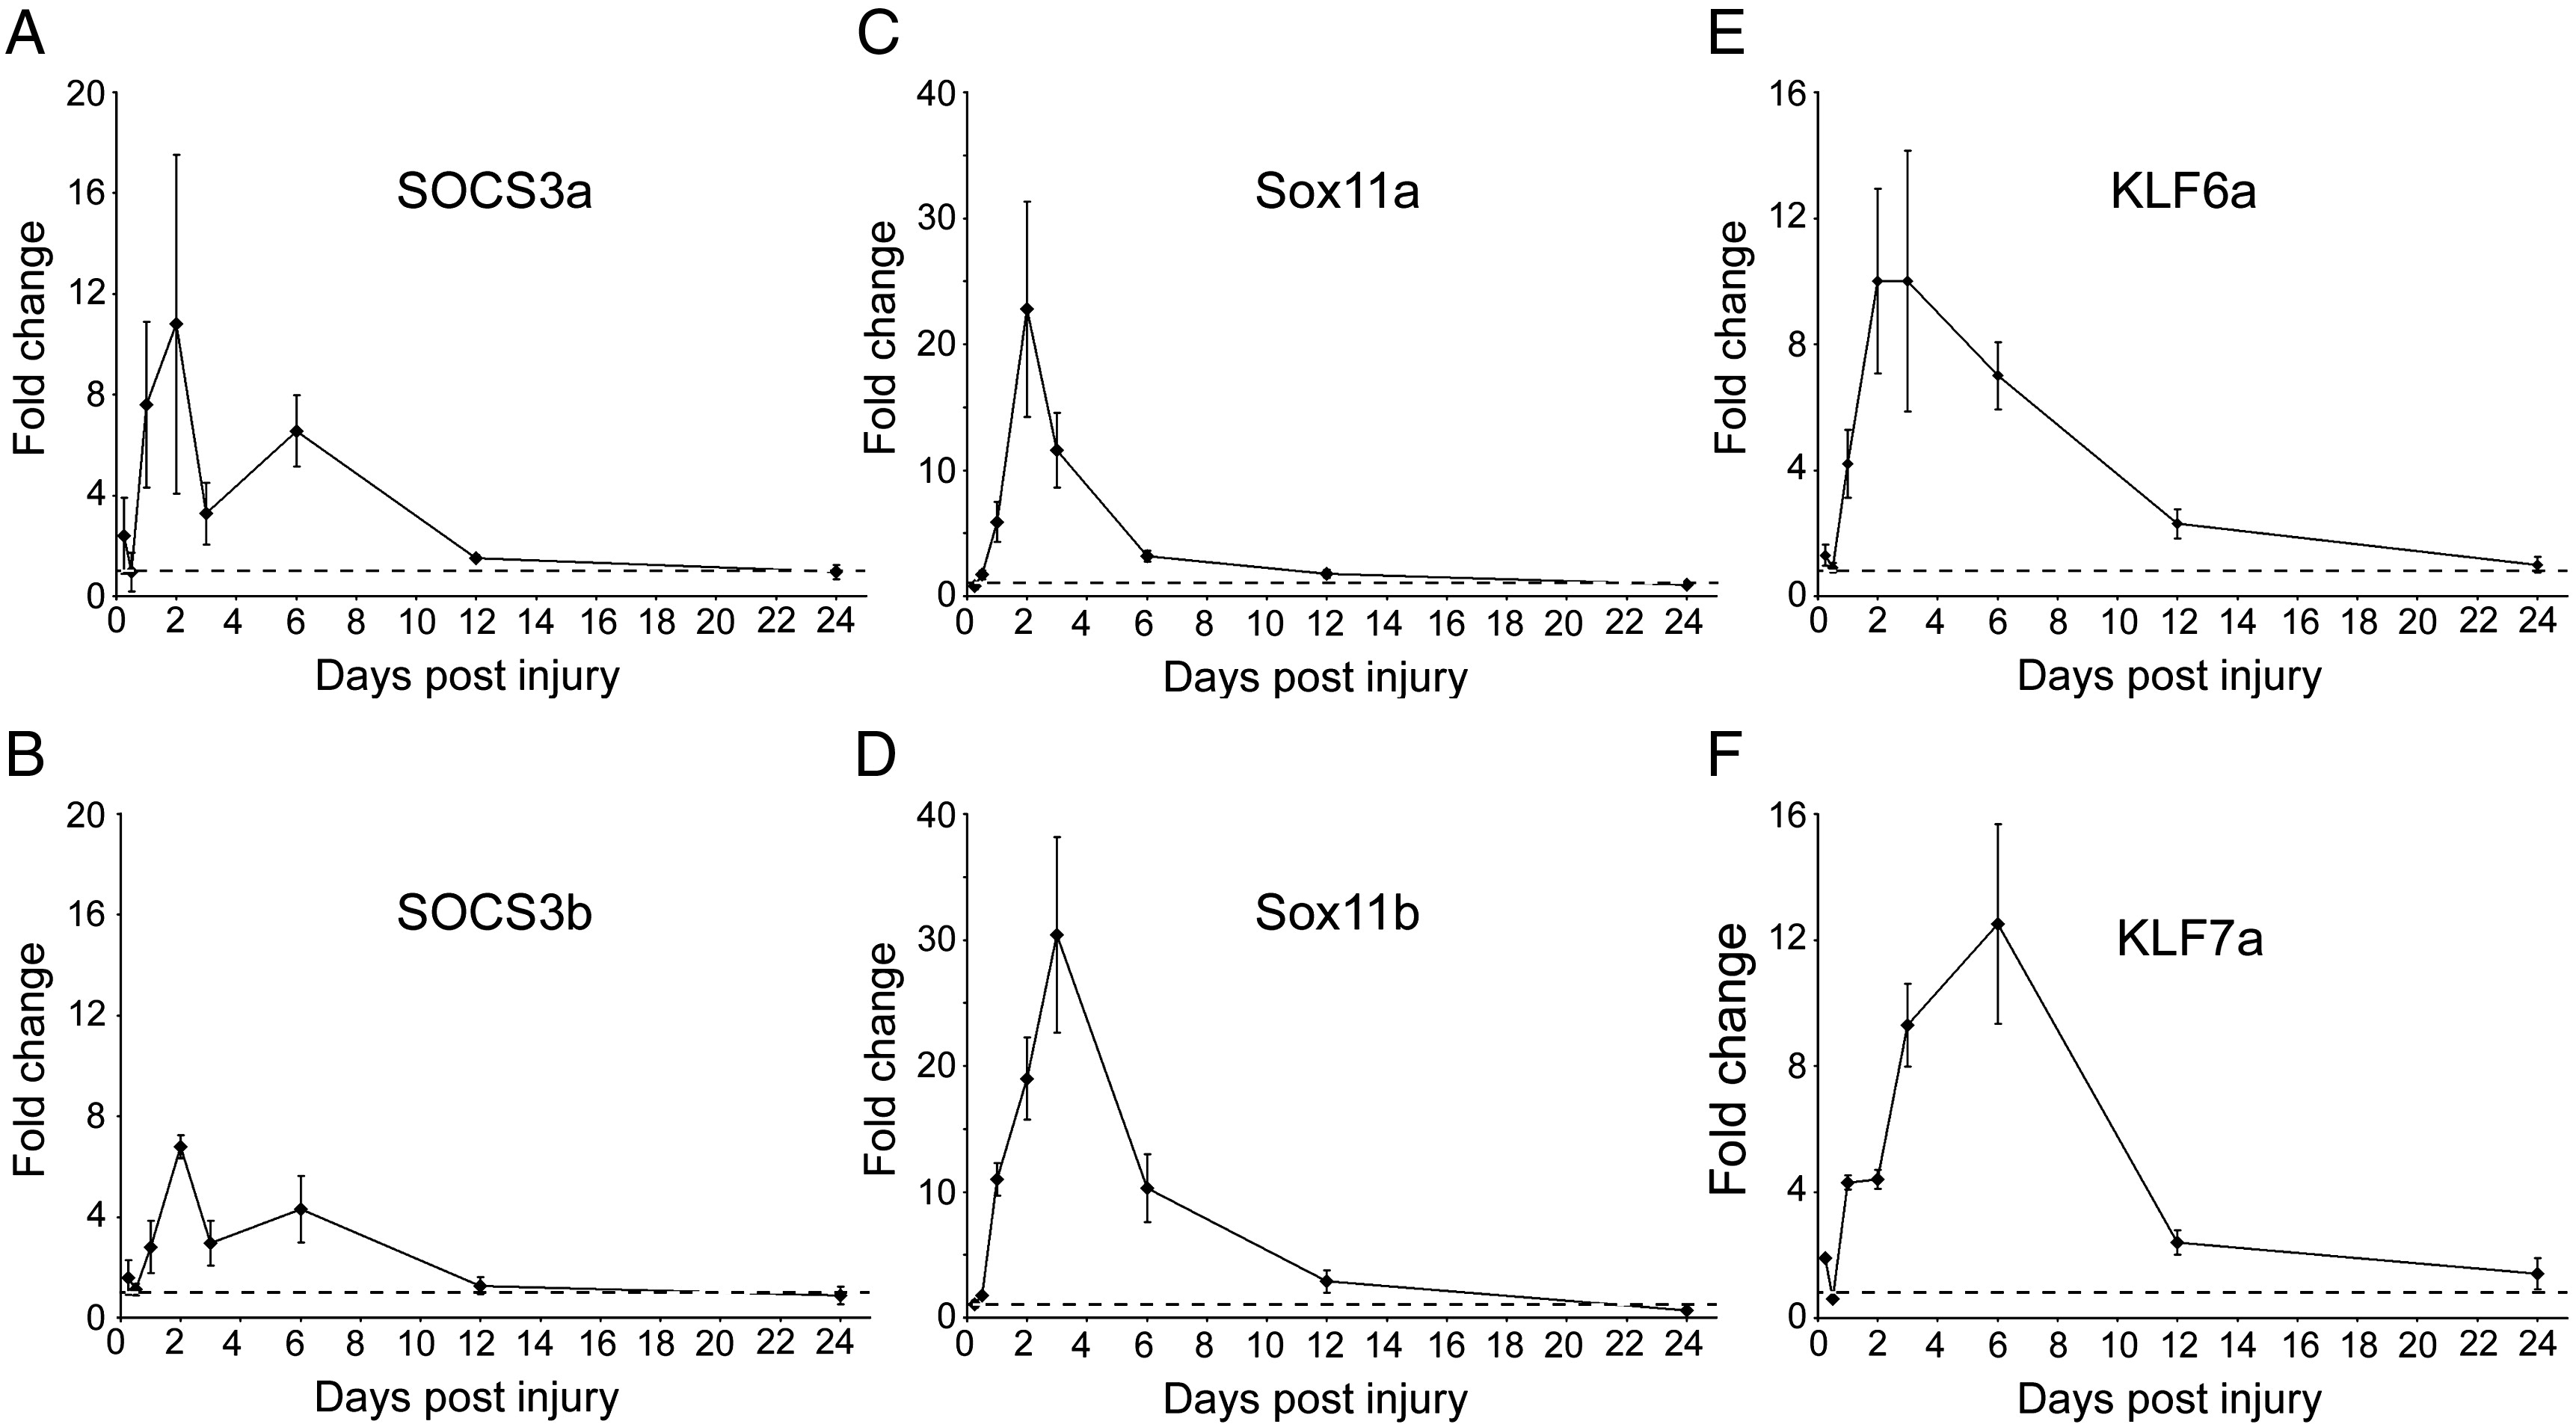
Fig. 5 Quantitative RT-PCR time course of gene expression in the retina following optic nerve crush injury. Quantitative real-time RT-PCR was used to measure mRNA levels in the retina at various time points following optic nerve crush injury as compared to uninjured retina. Expression of GAPDH was used to normalize all samples. SOCS3a (A), SOCS3b (B), Sox11a (C), Sox11b (D), KLF6a (E), and KLF7a (F) are all induced by 1-day post-injury (dpi), peak around 2–6 dpi and return to basal levels by 12–24 dpi. The dotted line denotes basal uninjured levels in each graph.
Figure Data
Acknowledgments
This image is the copyrighted work of the attributed author or publisher, and
ZFIN has permission only to display this image to its users.
Additional permissions should be obtained from the applicable author or publisher of the image.
Reprinted from Developmental Biology, 312(2), Veldman, M.B., Bemben, M.A., Thompson, R.C., and Goldman, D., Gene expression analysis of zebrafish retinal ganglion cells during optic nerve regeneration identifies KLF6a and KLF7a as important regulators of axon regeneration, 596-612, Copyright (2007) with permission from Elsevier. Full text @ Dev. Biol.