
Fig. 2
- ID
- ZDB-IMAGE-070918-23
- Genes
- Publication
- Phillips et al., 2006 - Zebrafish msxB, msxC and msxE function together to refine the neural-nonneural border and regulate cranial placodes and neural crest development
- All Figures
- Figures for Phillips et al., 2006
|
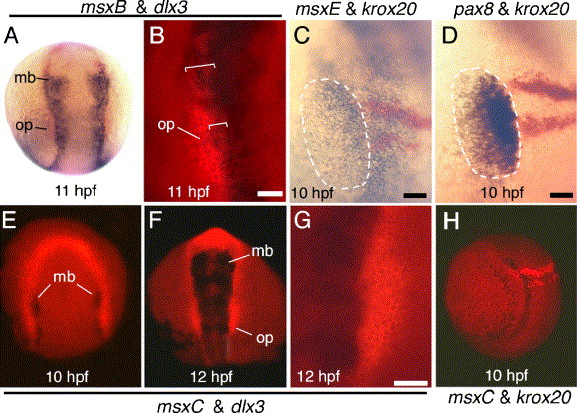
Fig. 2 Expression of msx genes relative to preplacodal and neural markers. (A, B) Expression of msxB (black) and dlx3b (red) at 11 hpf. Panel B is a fluorescent enlargement of the left otic placode of the specimen in panel A. Brackets show extent of overlap in gene expression. (C, D) Comparison of preotic domains of msxE (C) and pax8 (D) at 10 hpf. Expression of krox20 (red) is shown to facilitate alignment of embryos, and the preotic placode is outlined (dashed white line). (E) Expression of msxC (black) and dlx3b (red) at 10 hpf. The cranial mesoderm domain of msxC is not visible in this image. (F, G) Expression of msxC (black) and dlx3b (red) at 12 hpf. Panel G is a fluorescent enlargement of the right otic placode of the specimen in panel F. (H) expression of msxC (black) and krox20 (red) at 10 hpf. Abbreviations: mb, midbrain; op, otic placode. All specimens are dorsal views with anterior to the top except for panel C which is a lateral view with anterior to the top and dorsal to the right. Scale bars, 50 μm.
Reprinted from Developmental Biology, 294(2), Phillips, B.T., Kwon, H.J., Melton, C., Houghtaling, P., Fritz, A., and Riley, B.B., Zebrafish msxB, msxC and msxE function together to refine the neural-nonneural border and regulate cranial placodes and neural crest development, 376-390, Copyright (2006) with permission from Elsevier. Full text @ Dev. Biol.