
Fig. 3
- ID
- ZDB-IMAGE-060605-22
- Genes
- Publication
- Pyati et al., 2006 - Sustained Bmp signaling is essential for cloaca development in zebrafish
- All Figures
- Figures for Pyati et al., 2006
|
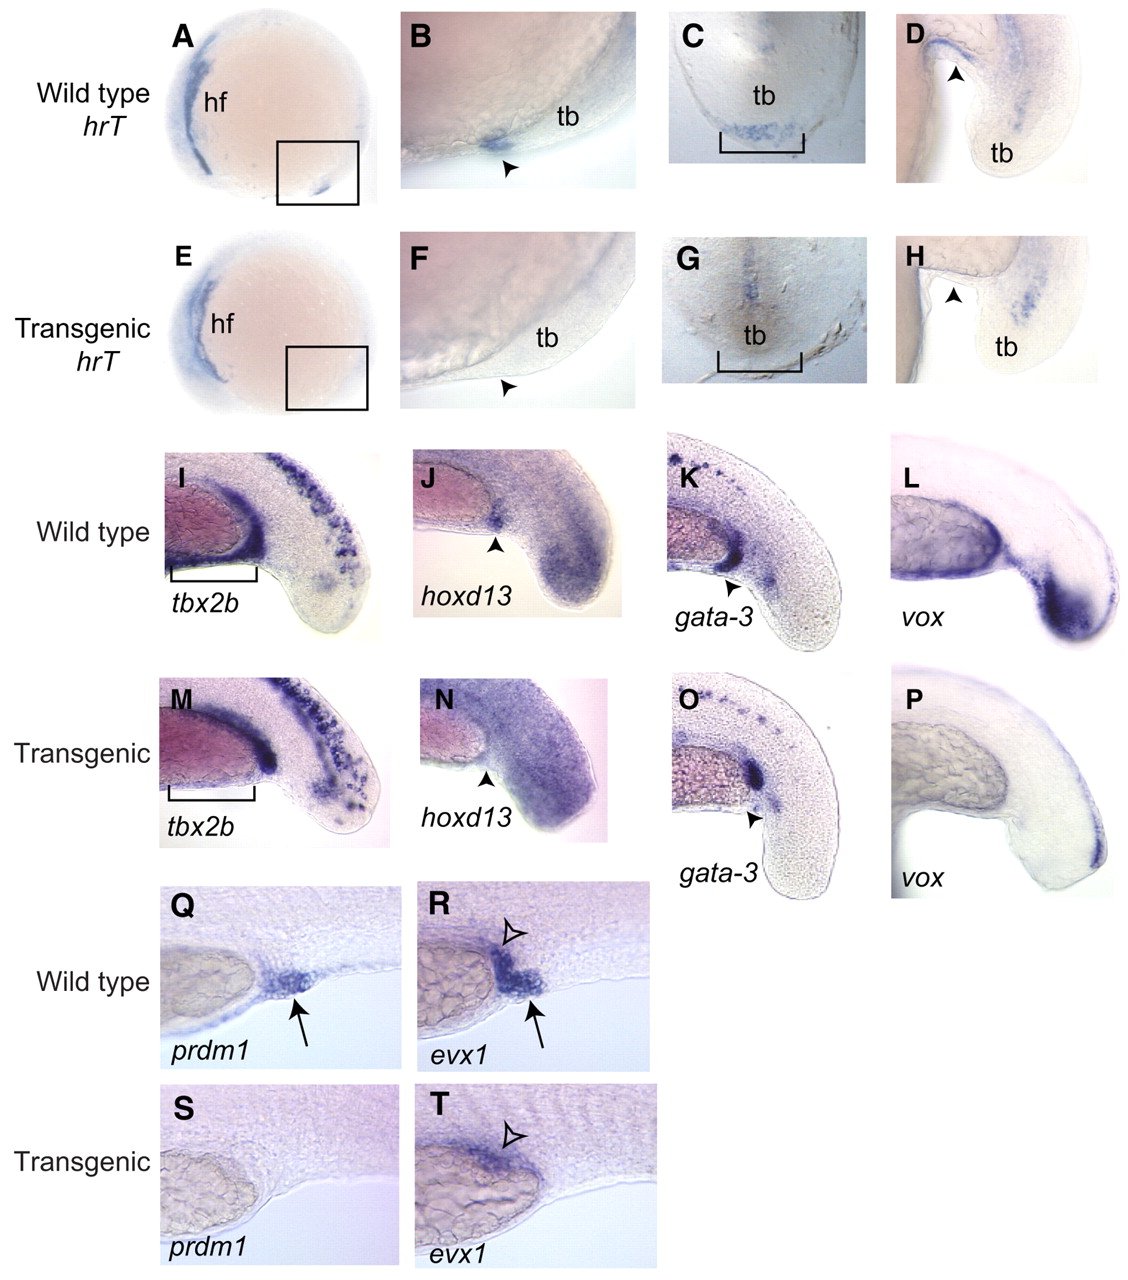
Fig. 3 Reduced ventral gene expression in transgenic embryos. (A-C,E-G) 10-somite wild-type (A-C) and transgenic (E-G) embryos stained for hrT gene expression. A,B,E,F are lateral views; C,G are flat mounts. `hf' in A,E labels the heart-field expression of hrT, which is normal in transgenic embryos compared with wild-type siblings. The boxed region highlights the extreme ventral mesoderm, enlarged in B and F; arrowheads denote the ventral mesodermal domain. The bracketed regions in C and G show this same region in flat-mounted embryos. (D,H) 18-somite-stage wild-type (D) and transgenic (H) embryos stained for hrT expression. Arrowheads indicate the ventral mesodermal hrT expression. (I,M) 18-somite-stage embryos stained for tbx2b expression in wild-type (I) and transgenic (M) embryos. Brackets indicate extreme ventral tbx2b expression in the proctodeal and ventral yolk regions; this expression is absent in the transgenic embryos. (J,N) 18-somite stage embryos stained for hoxd13 in wild-type (J) and transgenic (N) embryos. Arrowheads indicate the proctodeal region, where hoxd13 expression is absent in transgenics compared with wild-type siblings. Note that the posterior expression of hoxd13 expands anteriorly in the transgenic embryos. (K,O) gata3 expression in wild-type (K) and transgenic (O) embryos. Arrowheads indicate the ventral limit of the normal pronephric terminus. (L,P) vox expression in wild-type (L) and transgenic (P) embryos. Note the loss of ventral expression in transgenic embryos compared with wild-type siblings. (Q-T) prdm1 (Q,S) and evx1 (R,T) expression in wild-type and transgenic embryos at 24 hpf. Note the loss of prdm1 expression in the epidermis and cloaca of transgenic embryos. evx1 expression is absent in the cloaca of transgenic embryos, but it is retained in the posterior gut and posterior kidney tissues. Arrows in Q and R mark the cloacal domain of prdm1 and evx1 expression, respectively, and arrowheads in R and T mark the posterior gut and kidney expression of evx1.