
Fig. 2
|
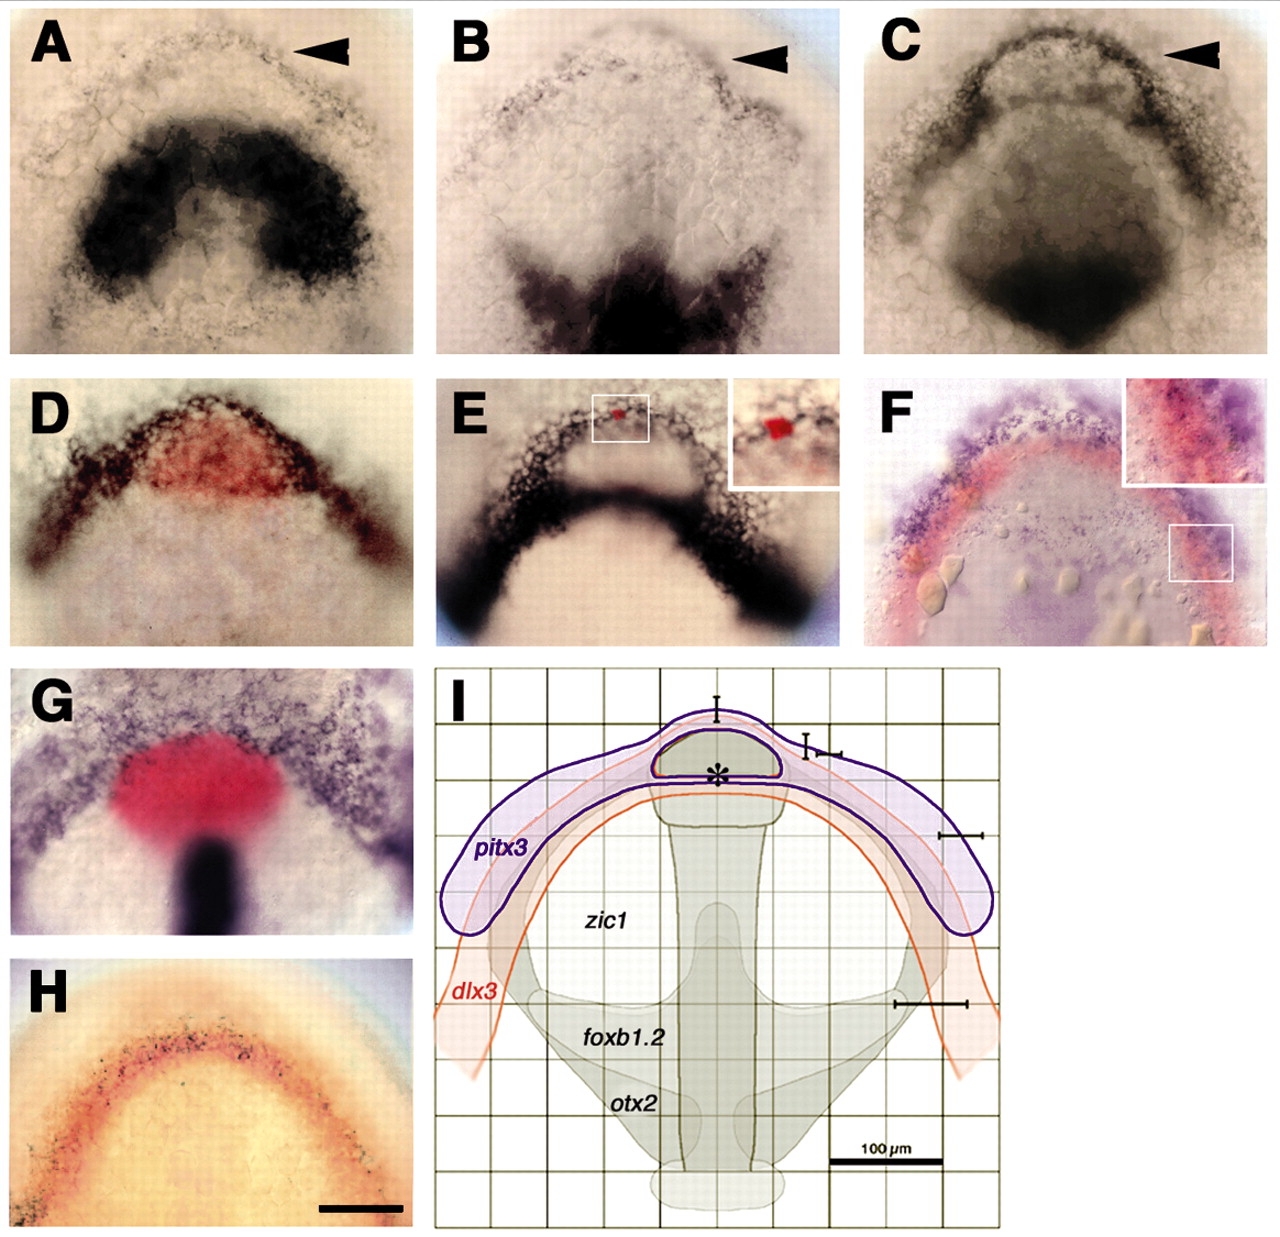
Fig. 2 pitx3 and dlx3b form overlapping expression domains at the anterior neural plate border. (A-D) Embryos labeled with probes for pitx3 (arrowheads) and (A) zic1, (B) foxb1.2; (C) pax6a or (D) hgg1 (red). (E) Anterior neural plate border cells express dlx3b. (E, inset) Single cell injected with fluorescein-dextran, labeled for lineage tracer (red). (F-H) A subset of cells co-expresses: (F) pitx3 (blue) and dlx3b (red); (G) bmp2b (blue, non-neural ectoderm), shh (blue, neural plate midline) and hgg1 (red, polster); (H) dlx3b (red) and eya1 (black). (I) Sketch of anterior neural plate gene expression domains (pitx3, blue, n=12; dlx3b, red, n=15; zic1, foxb1.2, otx2, grey) (Varga et al., 1999) to predict location of pitx3-expressing cells in live unlabeled embryos. Averaged gene expression domains; bars indicate standard deviations from the mean, relative to neural plate midline and center of polster (asterisk). All panels at bud stage, except C, which is at the one-somite stage. Dorsal views of prospective head region, ventral towards the top. Scale bars: 100 µm.