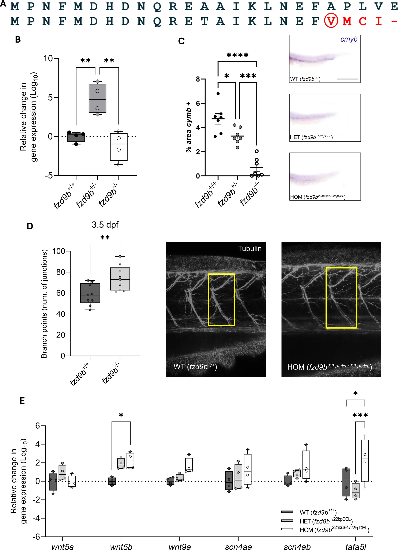
Characterization of the fzd9b 22 bp deletion (fzd9b22bpDEL) line. A) BLAST alignment of the predicted amino acids (aa) sequences for wildtype Fzd9b (WT, top) and the products predicted from the mutant allele (bottom), showing the region of exon 1 used for genotyping (see Sup. Fig. 2). Red circle marks the mutation starting site, altered residues are in red and stop codon is shown as a dash (-). B) Relative gene expression (log10 scale) of fzd9b in 5 dpf larvae; each point represents a pool of 16 larvae (N = 4 per genotype); bars show mean ± standard error mean (SEM). C) Quantification of the whole mount in situ hybridization (ISH) for cmyb at the tail of 40 hpf embryos (N = 7 per genotype); right panel shows representative images. D) Quantification of neuronal branch points following acetylated tubulin immunostaining and skeleton analysis in larval tails; graphs show individual values and mean ± SEM; representative images are shown alongside with yellow rectangles depicting areas analysed. E) qPCR analysis of wnt5a, wnt5b, wnt9a, scn4aa, scn4ab and tafa5l expression in the same 5 dpf larval pools used in panel B; graphs show box-and-whiskers (min to max) with mean as a central line; dots represent biological replicates. Statistical details are provided in Sup. Table 1. In all cases: * p < 0.05, ** p < 0.01, *** p < 0.001, **** p < 0.000 vs. corresponding pairwise comparison; Scale bars represent 25 µm
|
