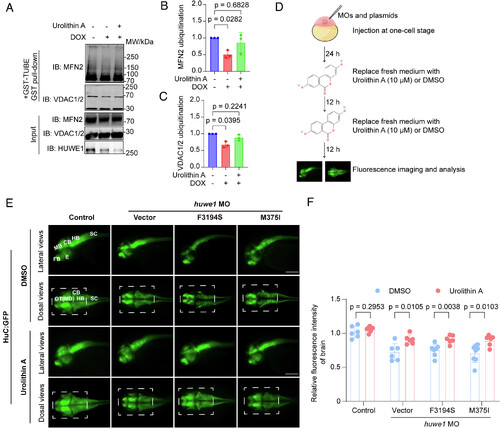
Urolithin A partially rescues neurodevelopmental defects caused by defective HUWE1. (A) GST-TUBE pull-down analysis of MFN2 and VDAC1/2 ubiquitination in HEK293T cells with inducible HUWE1 knockdown. Cells were incubated with DOX (1 μg/mL) for 72 h to deplete HUWE1 and then exposed to Urolithin A (10 μM) for 24 h. MG132 (10 μM) and BafA1 (200 nM) were added for 6 h before GST-TUBE enrichment. (B and C) Quantification of ubiquitinated MFN2 (B) and VDAC1/2 (C) from the GST-TUBE pull-down assay in (A). Ubiquitination signals were measured with ImageJ, normalized to the corresponding input protein levels, and expressed relative to the DOX−/Urolithin A− group. Data are shown as mean ± SD from three independent experiments. Statistical significance was determined by one-way ANOVA followed by multiple-comparison analysis. (D) Experimental workflow for Urolithin A treatment in zebrafish embryos. Morpholinos and plasmids were injected at the one-cell stage. At 24 hpf, embryos were transferred to embryo medium containing Urolithin A at a final concentration of 10 μM. Control embryos were maintained in medium containing the same concentration of vehicle control, DMSO (0.2%, v/v). Treatment medium was refreshed every 12 h, and embryos were imaged by fluorescence microscopy at 48 hpf. (E) Representative fluorescence images of HuC-GFP expression in Tg(HuC:GFP) zebrafish embryos treated with DMSO or Urolithin A. Images are displayed as maximum-intensity projections of z-stacks. Anatomical regions are labeled as follows: FB, forebrain; MB, midbrain; OT, optic tectum; CB, cerebellum; HB, hindbrain; SC, spinal cord; E, eye. Lateral views are shown on the top, and dorsal views are shown on the bottom. (Scale bar, 200 μm.) (F) Quantification of HuC-GFP fluorescence intensity in the zebrafish brain at 48 hpf. HuC-GFP intensity was measured within the indicated brain region of interest marked by the white box in dorsal-view images. Values were normalized to the mean fluorescence intensity of the Control group, which was set to 1. Each group included 6 to 8 embryos. Control embryos injected with control morpholino (MO): n = 6 embryos in DMSO and n = 7 embryos in Urolithin A. huwe1 MO + Vector embryos coinjected with huwe1 MO and vector plasmids: n = 6 embryos in DMSO and n = 6 embryos in Urolithin A. huwe1 MO + HUWE1 F3194S embryos coinjected with huwe1 MO and human HUWE1 F3194S plasmids: n = 7 embryos in DMSO and n = 6 embryos in Urolithin A. huwe1 MO + HUWE1 M375I embryos coinjected with huwe1 MO and human HUWE1 M375I plasmids: n = 8 embryos in DMSO and n = 6 embryos in Urolithin A. Data are shown as mean ± SD. P values were calculated using two-way ANOVA followed by multiple-comparison analysis.
|
