
Fig. 5
- ID
- ZDB-FIG-260805-109
- Publication
- Yi et al., 2026 - HUWE1 targets mitochondria via RMC1 to promote neurodevelopment
- Other Figures
- All Figure Page
- Back to All Figure Page
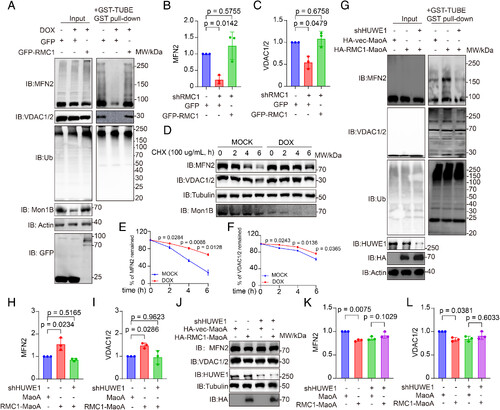
RMC1 cooperates with HUWE1 to promote ubiquitination and degradation of mitochondrial proteins. (A) GST-TUBE pull-down analysis of mitochondrial protein ubiquitination in HEK293T cells with inducible RMC1 knockdown. Cells were incubated with DOX (1 μg/mL) for 72 h to deplete RMC1 and then transfected with GFP vector or GFP-RMC1 for 18 h. Before GST-TUBE enrichment, cells were treated with MG132 (10 μM) and BafA1 (200 nM) for 6 h. (B and C) Quantification of ubiquitinated MFN2 (B) and VDAC1/2 (C) from the GST-TUBE pull-down assay in (A). Band intensities were measured with ImageJ, normalized to the corresponding input protein levels, and expressed relative to the GFP+DOX− group. Data are shown as mean ± SD from three independent experiments. Statistical significance was analyzed by two-way ANOVA followed by multiple-comparison analysis. (D) CHX chase analysis of MFN2 and VDAC1/2 stability in HEK293T cells with inducible RMC1 knockdown. Cells were cultured with DOX (1 μg/mL) for 72 h to induce RMC1 depletion and then exposed to DMSO for the 0 h time point or CHX (100 μg/mL) for 3, 6, or 9 h. (E and F) Quantitative analysis of MFN2 (E) and VDAC1/2 (F) protein stability from the CHX chase experiment in (D). Band intensities of MFN2 and VDAC1/2 were quantified using ImageJ and normalized to Tubulin. The remaining protein levels were calculated relative to the 0 h time point. Data represent mean ± SD from n = 3 independent experiments. P values were calculated using multiple paired t tests. (G) GST-TUBE pull-down analysis of mitochondrial protein ubiquitination in HEK293T cells with inducible HUWE1 knockdown. Cells were treated with DOX (1 μg/mL) for 72 h and then transfected with HA-MaoA vector or HA-RMC1-MaoA for 18 h. MG132 (10 μM) and BafA1 (200 nM) were added for 6 h before GST-TUBE enrichment. (H and I) Quantification of MFN2 (H) and VDAC1/2 (I) ubiquitination from the GST-TUBE pull-down assay in (G). Ubiquitination signals were quantified with ImageJ, normalized to input protein levels, and plotted relative to the HA-MaoA+DOX− group. Data are shown as mean ± SD from three independent experiments. Statistical significance was determined by two-way ANOVA followed by multiple-comparison analysis. (J) Immunoblot analysis of MFN2 and VDAC1/2 protein levels in HEK293T cells with inducible HUWE1 knockdown. After 72 h of DOX treatment (1 μg/mL), cells were transfected with HA-MaoA vector or HA-RMC1-MaoA for 18 h. (K and L) Quantification of MFN2 (K) and VDAC1/2 (L) protein levels from (J). Protein abundance was measured by ImageJ, normalized to Tubulin, and expressed relative to the HA-MaoA+DOX− group. Data represent mean ± SD from n = 3 independent experiments. P values were determined by two-way ANOVA followed by multiple-comparison analysis. |