
Fig. 4
- ID
- ZDB-FIG-260805-108
- Publication
- Yi et al., 2026 - HUWE1 targets mitochondria via RMC1 to promote neurodevelopment
- Other Figures
- All Figure Page
- Back to All Figure Page
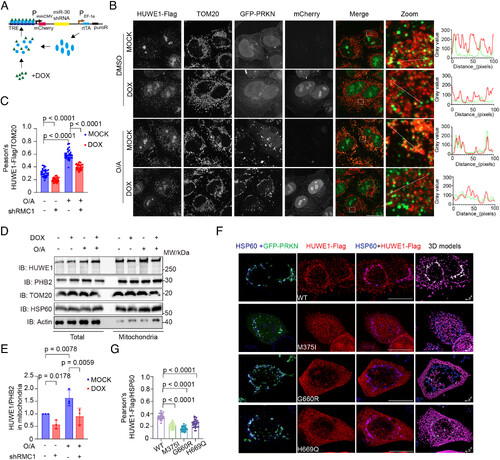
RMC1 is required for mitochondrial recruitment of HUWE1. (A) Scheme of DOX-inducible RMC1 shRNA construct. RMC1 depletion was induced by adding 1 μg/mL DOX to the culture medium of a GFP-PRKN-HeLa cell line stably transfected with pTSB-Tight-miR-30 shRMC1-tetR-F2A-Puro construct. (B) Representative confocal images showing HUWE1-Flag localization in GFP-PRKN-HeLa cells with inducible RMC1 shRNA. Cells were cultured with or without DOX (1 μg/mL) for 72 h to deplete RMC1, transfected with Flag-tagged HUWE1 constructs, and 18 h later exposed to DMSO or oligomycin A/antimycin A (O/A, 2.5 μM/0.8 μM) for 2 h. TOM20 was used to label mitochondria. Line-scan profiles indicate the fluorescence intensity distribution of HUWE1-Flag (green) and TOM20 (red) signals. (Scale bar, 10 μm.) (C) Quantification of HUWE1-Flag and TOM20 colocalization in (B). Each data point corresponds to the Pearson’s correlation coefficient measured from a single cell. Data are shown as mean ± SD. Statistical significance was assessed by two-way ANOVA followed by multiple-comparison analysis. (D) Immunoblot analysis of HUWE1 in isolated mitochondrial fractions. GFP-PRKN-HeLa cells expressing inducible RMC1 shRNA were incubated with or without DOX (1 μg/mL) for 72 h, treated with MG132 (10 μM) and BafA1 (200 nM) for 6 h, and then stimulated with DMSO or O/A (2.5 μM/0.8 μM) for 2 h. Mitochondrial fractions were isolated and analyzed by immunoblotting. TOM20, PHB2, and HSP60 were used as mitochondrial markers. (E) Quantification of mitochondrial HUWE1 levels from (D). HUWE1 band intensity was normalized to PHB2. Data are shown as mean ± SD from three independent experiments. The P values were calculated using two-way ANOVA followed by multiple-comparison analysis. (F) Three-dimensional confocal imaging analysis of HUWE1 variant localization to mitochondria. GFP-PRKN-HeLa cells were transfected with HUWE1 WT, M375I, G660R, or H669Q constructs for 24 h and then treated with O/A (2.5 μM/0.8 μM) for 2 h. HSP60 was used as a mitochondrial marker. HUWE1–HSP60 colocalization was visualized and analyzed using Imaris. (G) Quantification of HUWE1-Flag and HSP60 colocalization in (F). Each data point represents the Pearson’s correlation coefficient from one cell. Data are shown as mean ± SD. Statistical significance was determined by one-way ANOVA followed by multiple-comparison analysis. |