
Fig. 2
- ID
- ZDB-FIG-260805-106
- Publication
- Yi et al., 2026 - HUWE1 targets mitochondria via RMC1 to promote neurodevelopment
- Other Figures
- All Figure Page
- Back to All Figure Page
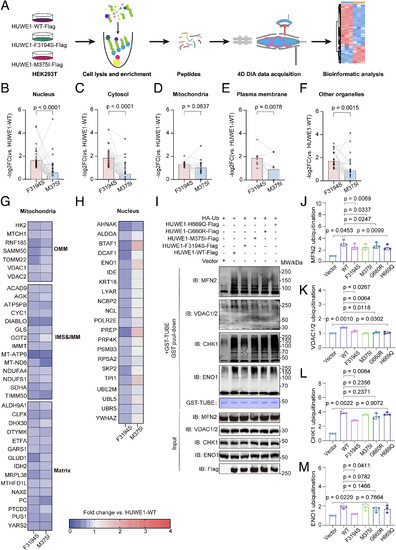
Noncatalytic HUWE1 variants associated with XLID reduce mitochondrial protein ubiquitination. (A) Schematic illustrating the process of TUBE-MS. HEK293T cells transfected with HUWE1-WT-Flag, HUWE1-F3194S-Flag, or HUWE1-M375I-Flag for 18 h were subjected to MG132 (10 μM) and BafA1 (200 nM) for 6 h. The cell extracts were incubated with GST-TUBE agarose before MS analysis. (B–F) Cellular component enrichment analysis of 132 candidate HUWE1 substrates obtained from GST-TUBE–MS. Proteins showing decreased ubiquitination in the HUWE1 F3194S group relative to HUWE1 WT were selected using a cutoff of log2(F3194S/WT) ≤ −1 and P < 0.05 by the t test. The MS analysis was performed with three biological replicates, and mean abundance values were used for quantification. For nonsignificant differences (M375I/WT, P ≥ 0.05, t test), log2(M375I/WT) was set to 0. −Log2 (F3194S/WT) and −log2 (M375I/WT) for the substrates among the nucleus (B), cytosol (C), mitochondria (D), plasma membrane (E), and other organelles (F) were quantified, P-values were determined by the Wilcoxon matched pairs signed-rank test. (G and H) Heatmaps of mitochondrial (G) and nuclear (H) ubiquitinated proteins in HUWE1 F3194S or HUWE1 M375I relative to HUWE1 WT. The color scale represents log2 fold change. (I) HEK293T cells were cotransfected with Flag-vector, HUWE1-WT-Flag, HUWE1-F3194S-Flag, HUWE1-M375I-Flag, HUWE1-G660R-Flag, or HUWE1-H669Q-Flag together with HA-Ub. Cell lysates were subjected to pull-down using GST-TUBE agarose, enriched ubiquitinated proteins and corresponding input samples were detected by immunoblotting with the indicated antibodies. (J–M) Densitometric quantification of ubiquitinated MFN2 (J), VDAC1/2 (K), CHK1 (L), and ENO1 (M). Signal intensities were quantified with ImageJ, normalized to input levels, and plotted relative to the Vector control. Data represent mean ± SD from n = 3 independent experiments, P values were calculated using one-way ANOVA with multiple-comparison analysis. |