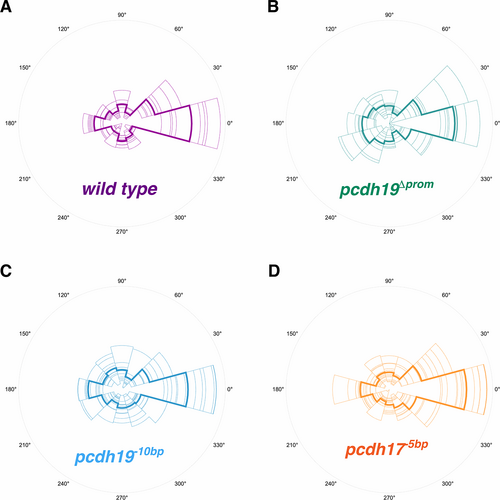
Distribution of preferred directions for direction selective neurons.
A. A polar histogram showing the preferred directions of direction selective neurons (DSI > 0.33) in wild type larvae (n = 9). The preferred direction as obtained as the vector average of the responses across all stimuli. The distributions for individual larvae are shown in thin lines and the pooled data is shown by the thick line. B. A polar histogram showing the preferred direction of direction selective neurons in pcdh19Δprom mutants (n = 9). The distributions for individual larvae are shown in thin lines and the pooled data is shown by the thick line. The distribution is significantly different from wild type (p < 0.0001; Watson’s U2 test). C. A polar histogram showing the preferred direction of direction selective neurons in pcdh19-10bp mutants (n = 12). The distributions for individual larvae are shown in thin lines and the pooled data is shown by the thick line. The distribution is significantly different from wild type (p < 0.0001; Watson’s U2 test). D. A polar histogram showing the preferred direction of direction selective neurons in pcdh17-5bp mutants (n = 13). The distributions for individual larvae are shown in thin lines and the pooled data is shown by the thick line. The distribution is significantly different from wild type (p < 0.0001; Watson’s U2 test).
|
