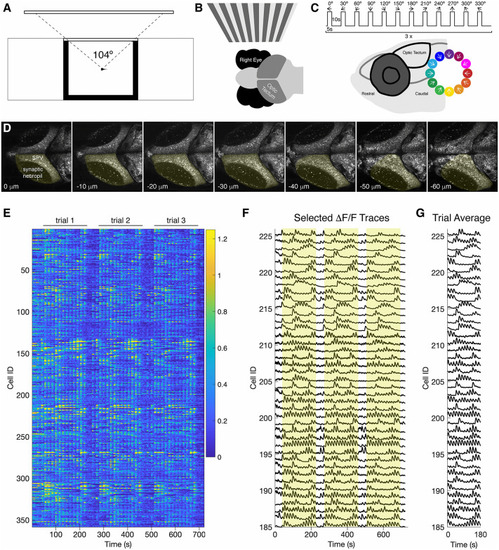
Calcium-imaging of neural responses to oriented sinusoidal gratings.
A. Schematic of the experimental setup. A 6dpf larva is embedded in agarose in an imaging chamber, allowing 104° view of a projection screen. B. The visual stimuli are presented to the right eye and the neural responses are visualized in the contralateral (left) hemi-tectum. C. The stimulation protocol is a series of 5s on 10s off of a moving sinusoidal grating, 12 directions spaced at 30° intervals to encompass the full 360°. This is repeated three times. Below is a lateral view of the head of a zebrafish larva. The inset shows the directions of motion of sinusoidal gratings with reference to the rostro-caudal axis of the fish. The direction color-code is used throughout the paper. D. Image stacks consisting of 7 optical sections spaced at 10 μm were collected at 1s intervals. Shown are average intensity images of individual planes from a timelapse sequence collected in a 6 dpf transgenic larva, Tg(elav3l:HistoneH2B-GCaMP8s). The visually-responsive hemi-tectum is outlined in yellow. E. Example data showing all the fluorescence traces from visually-responsive neurons collected from one larva. F. ∆F/F traces selected from those shown in E. Each 180 s trial is highlighted with yellow boxes. The full timecourse is 735 s. G. Responses were averaged across the three trials (180 s). Shown are the trial averages from the traces in F.
|
