
Fig. 3
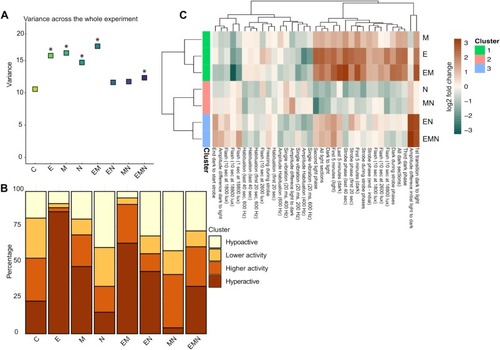
Variance and global activity in response to each stimulus of the MSA in 8 dpf larvae prenatally exposed. A. Inter-individual variance in all conditions during the whole experiment. Animals from single drug-exposed groups and from the EM and EMN groups had a greater variance across the duration of the MSA. B. Manual thresholding based on the average log2 fold change for each larva across the duration of the MSA. The categories were separated as follows: Hypoactive log2 fold change lower than −1, Lower activity log2 fold change between −1 and 0, Higher activity log2 fold change between 0 and 1 and Hyperactive log2 fold change greater than 1. Control animals showed a homogenous distribution, while E- and EM-exposed larvae were primarily found in the hyperactive cluster. Almost no hyperactive individuals were observed in the MN group. C. Hierarchical clustering of the different treatments (y-axis) based on the log2 fold change across the various parameters we measured. Heatmap colours indicate the log2 fold change compared to controls, where orange and green reflect increased and decreased responses, respectively. Clusters were then generated based on similar responses. This analysis revealed three main clusters: one grouping M, E and EM animals, a second including N and MN animals and a third composed of EN and EMN animals. n ≥ 24 per condition. A: * = p < 0.05 compared to the control group. Significance was assessed using a Levene test, followed by a Benjamini–Hochberg correction for multiple comparisons. |