|
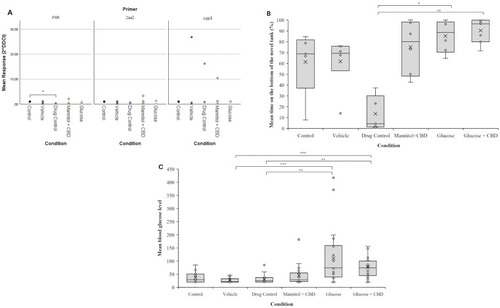
Validation of experiment parameters through liver cytochrome levels, novel tank assay, and blood glucose levels. (A) RT-qPCR results of liver tissue assessed for markers of liver metabolism using primers for PXR, cyp2aa2 (2aa2), and cyp3c1 (cyp3) genes. Values were first normalized to housekeeping (hkg) gene rpl13a, and are graphed as fold change relative to Control, set as 1. Kruskal Wallis nonparametric ANOVA followed by pairwise comparisons revealed a significant decrease in PXR expression in livers from Drug Control fish compared to Control (p = 0.04; mean ± SE expression; 0.17 ± 0.09) There were no other significant differences between groups. Biological replicates n = 3 for every group. (B) Analysis of novel tank data showed Drug Control fish spent significantly less time (13.54 ± 7.19%) at the bottom of the tank compared to hyperglycemic zebrafish (p = 0.023; 85.3 ± 6.07% time at the bottom) and Glucose + CBD fish (p = 0.002; 90.36 ± 4.27% time at the bottom). (C) Four weeks of glucose exposure significantly elevated blood glucose levels. A Kruskal Wallis nonparametric ANOVA identified a significant overall effect of treatment on blood glucose levels (p < 0.001). Hyperglycemic and Glucose + CBD zebrafish had significantly higher blood glucose levels than Vehicle (p = 0.003) and Drug Control (p = 0.002) groups. Blood sugar levels of hyperglycemic fish were not different from blood sugar values of Glucose + CBD fish. Control n = 14, Vehicle n = 19, CBD/Drug Control n = 21, Mannitol + CBD n = 21, Hyperglycemia/Glucose n = 24, Glucose + CBD n = 20. Individual data points from biological replicates are shown in (A); whereas distribution across replications are presented as box and whisker plots in (B) and (C). * < 0.05, ** < 0.01, and *** < 0.001. Condition = treatment + exposure groups.
|