
Figure 8
- ID
- ZDB-FIG-260501-116
- Publication
- De Rycke et al., 2026 - Systematic Disruption of Zebrafish Fibrillin Genes Identifies a Translational Zebrafish Model for Marfan Syndrome
- Other Figures
- All Figure Page
- Back to All Figure Page
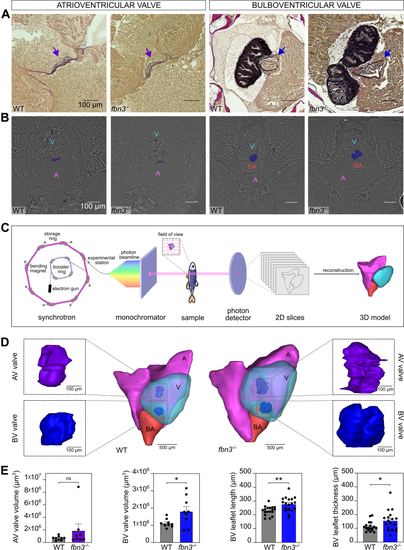
Abnormal Cardiac Valve Architecture of Adult fbn3–/– ZF (A) Histologic staining for elastin (purple) of the atrioventricular (AV) valve (left, purple arrow) and bulboventricular (BV) valve (right, blue arrow) of WT ZF and fbn3–/– ZF (6 and 8 mpf). The architecture of the AV valve is normal in the majority of the samples (representative histology picture), whereas the BV valve leaflets are abnormal in shape in all mutants. (B) Representative images of ZF hearts obtained by synchrotron radiographic scanning. Cardiac valves are shown in color (AV valve, purple; BV valve, blue). (C) Schematic representation of synchrotron radiographic imaging method of ZF samples. (D) Representative three-dimensional (3D) models of WT ZF (left) and fbn3–/– ZF (right) (16 and 18 mpf). Enlarged models of cardiac valves are shown to display the differences between WT and mutants. (E) Volume, length, and thickness measurements of AV (purple) and BV (blue) valves obtained from the 3D models (n = 9). Values are mean ± SEM. ∗P < 0.05, ∗∗P < 0.01. Statistical test analysis: Mann-Whitney U test (AV valve volume), unpaired Student’s t-test (BV valve volume, BV leaflet length, and BV leaflet thickness). 2D = 2-dimensional; A = atrium; other abbreviations as in |
| Fish: | |
|---|---|
| Observed In: | |
| Stage: | Adult |