
Figure 1
- ID
- ZDB-FIG-260501-109
- Publication
- De Rycke et al., 2026 - Systematic Disruption of Zebrafish Fibrillin Genes Identifies a Translational Zebrafish Model for Marfan Syndrome
- Other Figures
- All Figure Page
- Back to All Figure Page
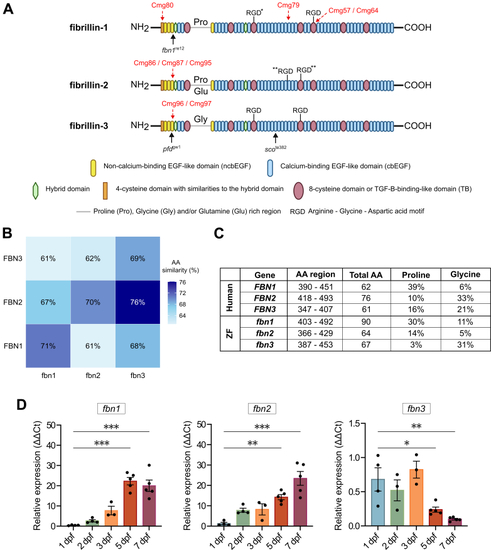
Overview of the Three Fibrillin Isoforms in ZF (A) Schematic representation of the protein domains identified in all 3 zebrafish (ZF) fibrillin isoforms (fibrillin-1, fibrillin-2, and fibrillin-3). Unique proline/glycine/glutamine (Pro/Gly/Glu)–rich regions and the various RGD-motifs are indicated, some of which are exclusively present in ZF (asterisk). CRISPR/Cas9–induced recombination sites are indicated with a red arrow; mutation sites in previously reported ZF models are also annotated with a black arrow. (B) Heatmap showing the percentage of amino acid (AA) sequence similarity between human fibrillin proteins (y-axis) and their ZF orthologs (x-axis). Sequence similarity was calculated by using the Clustal Omega program (version 1.2.4). (C) Comparison of the relative contribution of Pro and Gly in the Pro/Gly–rich region between human and ZF fibrillins. (D) Messenger ribonucleic acid expression pattern of the fibrillin isoforms in wild-type ZF embryos at 1, 2, 3, 5, and 7 days postfertilization (dpf) (n = 3-5 for each developmental stage). Values are mean ± SEM. Statistical test analysis: one-way analysis of variance followed by Dunnett’s multiple comparisons test on log-transformed data. ∗P < 0.05, ∗∗P < 0.01, ∗∗∗P < 0.001. ΔΔCt = comparative threshold cycle. |
| Genes: | |
|---|---|
| Fish: | |
| Anatomical Term: | |
| Stage Range: | Prim-5 to Days 7-13 |