
Figure 5
- ID
- ZDB-FIG-260501-113
- Publication
- De Rycke et al., 2026 - Systematic Disruption of Zebrafish Fibrillin Genes Identifies a Translational Zebrafish Model for Marfan Syndrome
- Other Figures
- All Figure Page
- Back to All Figure Page
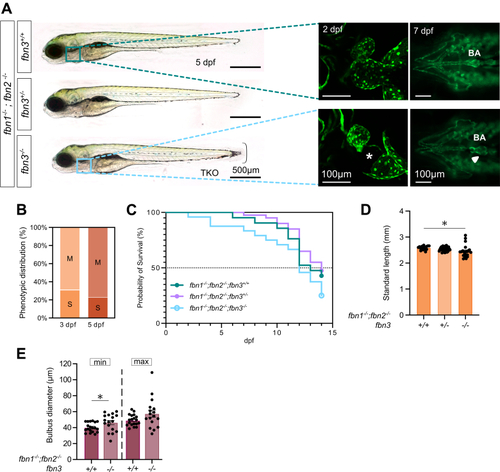
Phenotypic Features of TKO Larvae Representative images of the phenotypes observed in 3 to 7 dpf fbn1–/–; fbn2–/–; fbn3+/+, fbn1–/–; fbn2–/–; fbn3+/–, and fbn1–/–; fbn2–/–; fbn3–/– larvae. (A, left) Lateral whole-embryo view of a 5 dpf triple fibrillin knockout (TKO) without complete endocardial detachment and sibling controls, using brightfield microscopy. Accolade: fin-fold atrophy. (A, middle) Reconstructed maximum intensity projection in vivo confocal fluorescent images of the heart of 2 dpf Tg(kdrl:GFP) WT and TKO ZF. Endocardial detachment (asterisk) is observed in the atrium of a subset of TKO ZF. (A, right) Fluorescent ventral images of 7 dpf Tg(kdrl:GFP) TKO and sibling controls with preserved endocardial integrity. White arrowhead indicates dilated BA. (B) Phenotypic distribution (%) of TKO ZF presenting a mild (M) or severe (S) pericardial phenotype and their dynamics over time (3 and 5 dpf) (n = 21). (C) Fourteen-day Kaplan-Meier survival curve of the offspring of an incross of fbn1–/–; fbn2–/–; fbn3+/– ZF (n = 21-40). (D) Quantification of standard length at 3 dpf (n = 17-36). (E) Quantification of BA diameters at 7 dpf during minimal (min) and maximal (max) distension (n = 17-19). Statistical analysis: Fisher exact test B, Kaplan-Meier survival analysis C, one-way analysis of variance followed by Dunnett’s multiple comparison test D, and two-way analysis of variance followed by Tukey’s multiple comparisons test E. Values are mean ± SEM. ∗P < 0.05. Abbreviations as in |
| Fish: | |
|---|---|
| Observed In: | |
| Stage Range: | Long-pec to Days 7-13 |