
Figure 3
- ID
- ZDB-FIG-260501-111
- Publication
- De Rycke et al., 2026 - Systematic Disruption of Zebrafish Fibrillin Genes Identifies a Translational Zebrafish Model for Marfan Syndrome
- Other Figures
- All Figure Page
- Back to All Figure Page
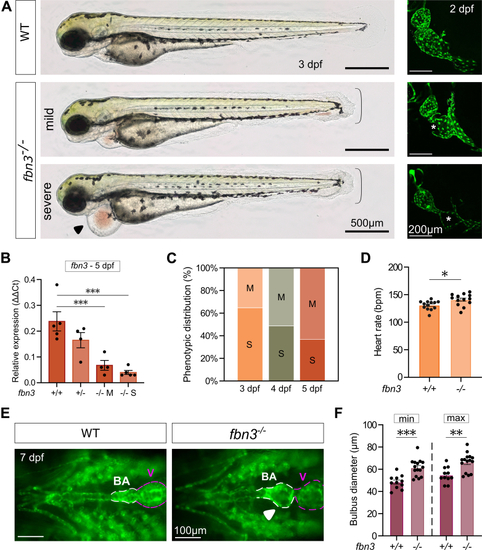
Cardiovascular Development in fbn3 Mutants Representative images of the diverse phenotypes observed in 2 to 7 dpf fbn3–/– (Cmg96) mutants and WT controls. (A, left) Lateral whole-embryo view of 3 dpf larvae using brightfield microscopy. Accolade indicates fin-fold atrophy; black arrowhead indicates severe pericardial edema. (A, right) Reconstructed three-dimensional in vivo two-photon fluorescent images of the non-beating heart of 2 dpf Tg(kdrl:GFP) WT ZF and fbn3–/– ZF. Endocardial detachment (asterisk) is observed in the atrium of the fbn3–/– ZF with pericardial edema. (B) Messenger ribonucleic acid expression levels of fbn3 in WT, fbn3+/–, and fbn3–/– (mild or severe) ZF at 5 dpf (n = 4-5). (C) Phenotypic distribution (%) of fbn3-deficient ZF presenting a mild (M) or severe (S) pericardial phenotype and their dynamics over time (3, 4, and 5 dpf) (n = average of 19 clutches; 50-100 embryos per clutch). (D) Quantification of the average heart rate in beats per minute (bpm) of 3 dpf fbn3–/– with preserved endocardial integrity and matching controls (n = 13). (E) Ventral view of 7 dpf Tg(kdrl:GFP) WT and fbn3–/– ZF with preserved endocardial integrity. White arrowhead indicates dilated BA. (F) Quantification of BA diameters at 7 dpf during minimal (min) and maximal (max) distension (n = 11-15). Each data point represents the mean of 2 technical replicates. Statistical analysis: one-way analysis of variance followed by Tukey’s multiple comparisons test on log-transformed data (B), Fisher exact test C, unpaired Student’s t-test D, and two-way analysis of variance followed by Tukey’s multiple comparisons test F. Values are mean ± SEM. ∗P < 0.05, ∗∗P < 0.01, ∗∗∗P < 0.001. V = ventricle; other abbreviations as in |
| Gene: | |
|---|---|
| Fish: | |
| Anatomical Term: | |
| Stage: | Day 5 |
| Fish: | |
|---|---|
| Observed In: | |
| Stage Range: | Long-pec to Days 7-13 |