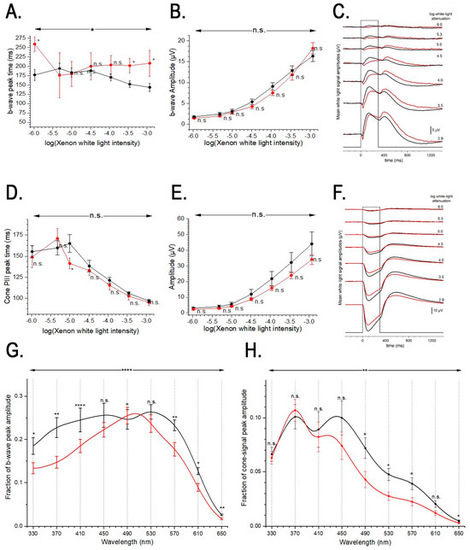
Cone PIII and b-wave responses in WT and miR-183−/− 10-month-old zebrafish. (A–C) The mean white light b-wave responses for miR-183 mutant (red traces) and WTTL (black traces) background strain eyes. (A) b-wave peak time, the median peak time of WTTL for all intensities was 160 ms compared to 205 ms for MiR183 (U = 1518, p < 0.05). (B) B-wave amplitude measured a-wave trough to b-wave peak. (C) Mean b-wave traces with light intensity (given in log units white light attenuation). miR-183, mean of 5 eyes; WTTL control, mean of 20 eyes. (D–F) Isolated photoreceptor-only ERG responses (cone PIII) obtained by blocking signals from inner retinal neurons using L-aspartic acid. (D) Cone PIII peak time, (E) cone PIII amplitude, (F) mean cone PIII traces at different light intensities (given in log units white light attenuation). miR-183 (red traces), mean of 16 eyes; WTTL control (black traces), mean of 12 eyes. (G) Adult b-wave spectral sensitivity. Asterisks are Mann–Whiney U tests comparing the intensity response datasets at each measured wavelength and at all wavelengths, miR-183, 1050 datapoints; WTTL, 1820 datapoints. (H) Adult cone PIII spectral sensitivity with Mann–Whitney U tests at each wavelength and at all wavelengths, MiR-183,1820 datapoints; WTTL 1260 datapoints. Fish are 10 mpf. Error bars in graphs are s.e.m. * p < 0.05, ** p < 0.01, **** p < 0.0001. In (A,B,D,E). t-tests are used at individual irradiances and Mann–Whitney U tests for the overall intensity functions.
|
