
Fig. 5
- ID
- ZDB-FIG-260429-3
- Publication
- Chen et al., 2026 - miRNA 183 Knockout Alters Cone Subtype Distribution, Transcriptional Activity and ERG Signals in the Tetrachromatic Zebrafish Visual System
- Other Figures
- All Figure Page
- Back to All Figure Page
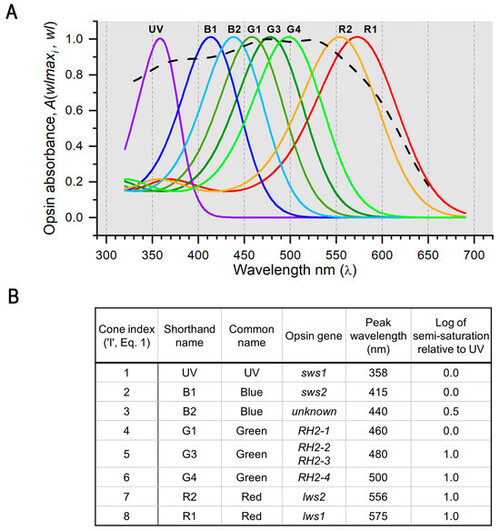
Algorithm for determining the signal strengths of the different cone types contributing to ERG spectral data. Aspartate-isolated cone signals from zebrafish eyes are a summation of signals from 8 cone types, each distinguished by different maximal amplitudes (Vmi), semi-saturation irradiances (ki), and opsin peak absorbances (wlmaxi). There are 255 unique combinations of 8 cones, each combination is a candidate to best model cone spectral responses in the ERG. (A) Spectral shapes of opsin absorbances [A(wlmaxi, wl)] are generated from 8th-order template polynomials [20,21] using Dartnall nomogram translations along the wavelength axis to represent opsins of different peak wavelengths [19] (Dartnall, 1953). The dashed line is the sum of the individual spectra. (B) Parameters for each of the i cone types are numbered in order from short to long wavelengths. SWS, short-wavelength-sensitive opsins; RH2, rhodopsin-like green-cone opsins; LWS, long-wavelength-sensitive opsins. |