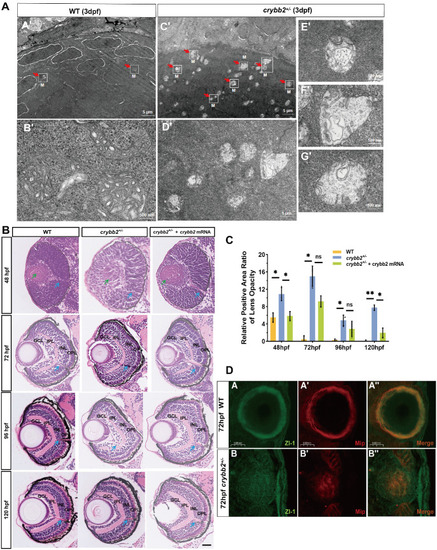
Ultrastructural, histological, and immunofluorescence analysis of lens development in WT and crybb2-knockout zebrafish. (A) TEM images of lens fiber cells in WT and crybb2+/− zebrafish at 3 dpf. N, nucleus (blue arrows); M, mitochondria (red arrows); L, lysosome (green arrows); M/L, mitochondria-lysosome fusion structures (yellow arrows), lens fiber cells. (B) H&E staining of lens sections from WT, crybb2 morphants (MO), and rescue (MO + mRNA) zebrafish at 48, 72, 96, and 120 hpf. Retinal layers were labeled as follows: PL, photosensitive layer; INL, inner nuclear layer; GCL, ganglion cell layer; OPL, outer plexiform layer; IPL, inner plexiform layer; LEC, lens epithelial cells; eLFC, elongated lens fiber cells. (C) Relative positive area ratio of lens opacity was measured in zebrafish from 24 to 120 hpf. The y-axis represents the relative opacity area ratio, and the x-axis indicates developmental time points. Data are presented as mean ± SEM. Statistical analysis was performed using one-way ANOVA followed by Tukey's post-hocmultiple comparisons test (*P < 0.05, **P < 0.01). (D) Immunofluorescence staining of zebrafish lenses at 72 hpf with Zl-1 (green) and Mip (red). Overlays show colocalization of Zl-1 and Mip signals (merged images). Scale bars are indicated in each panel.
|
