
Figure 9
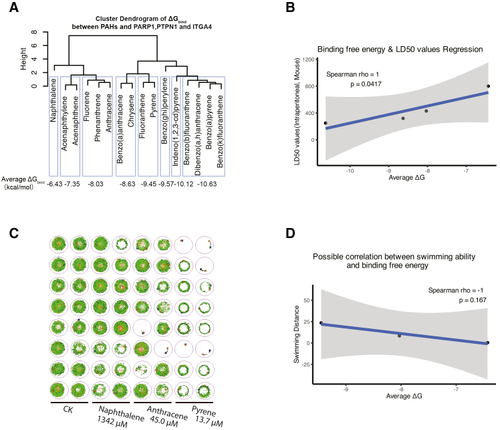
Models for predicting AD toxicity in PAHs (A) Linear regression of molecular ΔG against BMDL. Cluster dendrogram of average ΔG bind between PAHs and PARP1, PTPN1, and ITGA4. (B) Linear regression of molecular ΔG against LD50. (C) Representative swimming trajectories of individuals under different treatment groups (control group CK, naphthalene 1,342 μM, anthracene 45.0 μM, and pyrene 13.7 μM). Each circle represents the swimming path of an individual. (D) Correlation analysis between average ΔG and swimming distance. The blue line represents the linear regression fit, and the gray shading represents the 95% confidence interval. Spearman correlation coefficient (rho) and |