
FIGURE
Figure 5
Figure 5
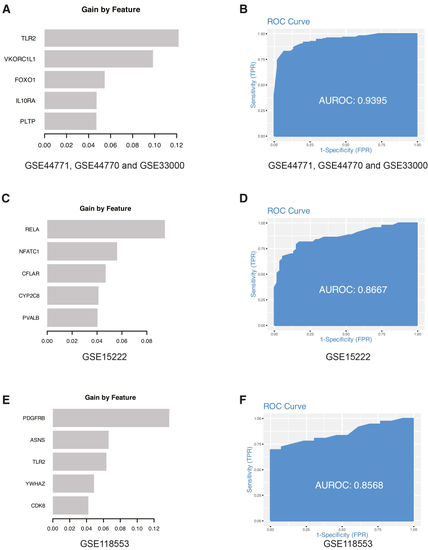
Feature importance with three different microarray gene expression datasets (A) The top five genes, ranked by feature importance score, in the three batch-corrected microarray gene expression datasets. (B) Overall prediction score of the XGBoost model in the three batch-corrected microarray gene expression datasets. (C and E) The top five genes were identified by feature importance score in (D and F) Overall prediction score of the XGBoost model in |
Expression Data
Expression Detail
Antibody Labeling
Phenotype Data
Phenotype Detail
Acknowledgments
This image is the copyrighted work of the attributed author or publisher, and
ZFIN has permission only to display this image to its users.
Additional permissions should be obtained from the applicable author or publisher of the image.
Full text @ iScience