
Figure 3
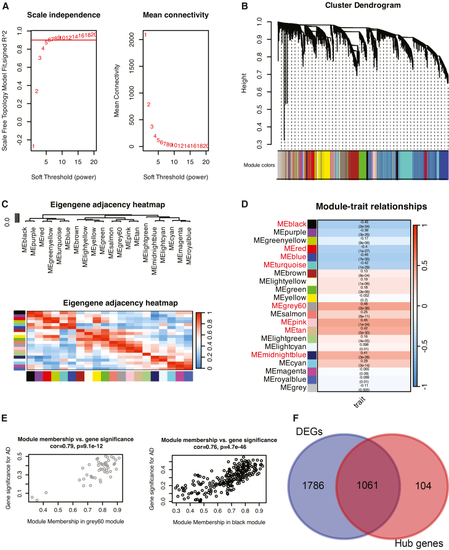
Identifying AD-associated hub genes using weighted correlation network analysis (A) Utilizing a scale-free topology model to determine the optimal β value, selecting β = 5 as the soft threshold based on average connectivity and scale independence. (B) Hierarchical clustering dendrogram showing module identifiers. The gene dendrogram was obtained by average linkage hierarchical clustering; colored rows below indicate module assignments determined by the dynamic tree cut. (C) Visualizing correlations between eigengenes. Dendrogram branches (meta-modules) combine positively correlated gene sets. The heatmap shows adjacencies in the Eigengenes network. Each row and column represents a module gene (indicated by color). Blue indicates low adjacency (negative correlation), while red indicates high adjacency (positive correlation). (D) Relationship diagram between module genes and AD. Each row corresponds to module eigengenes, and the column corresponds to AD. Cells are filled with the corresponding correlation and (E) Correlation between gray60 (or black) module membership and gene significance for AD. A highly significant correlation (0.79 or 0.76) between gene significance and module membership implies that hub genes in the turquoise module tend to be highly correlated with AD. (F) Intersection of hub genes with DEGs. In the WGCNA analysis, genes with a correlation coefficient, R > 0.4 for module-trait relationships and a module membership (kME_MM) > 0.8 were identified as hub genes in modules strongly associated with AD. |