|
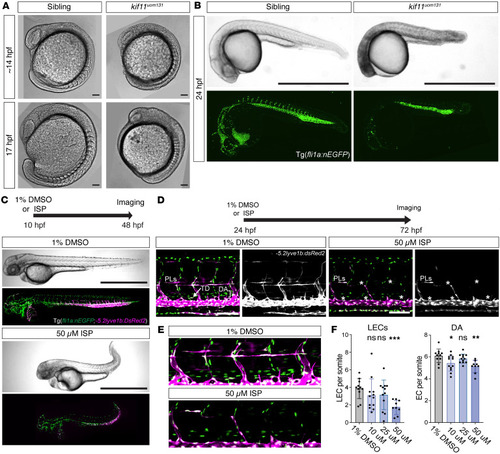
Genetic and pharmacological loss of kif11 results in abnormal embryonic and vascular development in zebrafish. (A) Differential inference contrast images of 14 and 17 hpf sibling (kif11+/+or+/uom131) and mutant embryos (kif11uom131). Somite defects, brain necrosis, and aberrant tail development observable in 100% of mutants at both time points (n = 8/8 mutants and n = 0/19 sibling at 14 hpf and n = 8/8 mutants and n = 0/7 sibling at 17 hpf). Scale bar: 100 μm. (B) Upper: brightfield images of sibling and mutant embryos at 24 hpf. Brain necrosis and reduced embryo size observable in mutants. Lower: confocal maximum projection images of Tg(fli1a:nEGFP) embryos showing reduced intersegmental vessel sprouting and vascular development likely consistent with delayed embryonic development (n = 26/26 mutants and n = 0/88 sibling). Scale bar: 1 mm. (C) Brightfield and confocal maximum projection images of DMSO control (upper) and treated (lower) embryos following exposure to 50 μM ispinesib (ISP) at 10–48 hpf. Tg(fli1a:nEGFP;lyve1b:DsRed2) used to visualize ECs, veins, and lymphatic progenitors (PL). ISP treatment caused brain necrosis, pericardial edema, and aberrant tail development (n = 26/26 ISP-treated, n = 27 1% DMSO). Scale bar: 1 mm. (D) Confocal maximum projection images of DMSO control or 50 μM ISP-treated Tg(fli1a:nEGFP;lyve1b:DsRed2) embryos at 72 hpf. ISP treatment 24 –72 hpf; 50 μM ISP-treated embryos showed impaired PL formation at horizontal myoseptum (quantified in E). Scale bar: 100 μm. (E) Zoomed images of DA and PLs from D. (F) Bar plots of EC numbers (per somite) in DA and PLs treated with increasing ISP concentrations (n = 11, 1% DMSO; n = 12, 10 μM ISP; n = 12, 25 μM ISP, n = 9, 50 μM ISP). Reductions in LECs and DA ECs were observed. Unpaired Student’s t test for normally distributed data and Mann-Whitney U test for non-normally distributed data. *P = 0.0261; **P = 0.0018; ***P = 0.0002; ns, nonsignificant. TD, thoracic duct; DA, dorsal aorta; EC, endothelial cell.
|