|
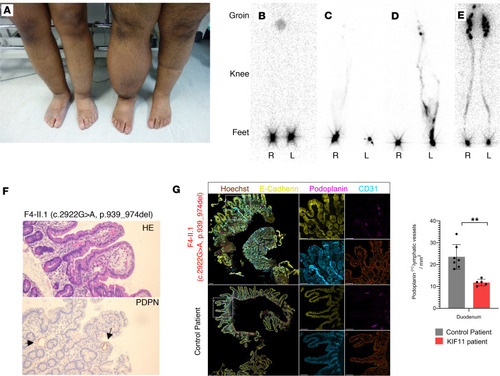
Patients with MLC show lymphatic abnormalities. (A) Photography of lower limbs of patients F3-II.1 and F3-II.2 showing asymmetrical lower limb lymphedema. (B–E) Lower limb lymphoscintigraphy 2 hours after injection of radionuclide (technetium-99) was used to image the lymphatic system (anterior view shown here). (B) Bilateral functional aplasia evidenced by no lymphatic drainage in either leg. (C) Significantly reduced function with rerouting in the right limb and functional aplasia of the left. (D) Functional aplasia of the right limb and abnormal tortuous tracts with patchy superficial rerouting on the left. (E) Unaffected patient with symmetrical transport of radionuclide tracer from injection sites in the feet up to the inguinal lymph nodes via main lymphatic vessels. (F) Intestinal biopsy of patient F4-II.1 with KIF11 variant c.2922G>A; p.939_974del. H&E staining shows aberrant morphology of the lacteals; podoplanin (PDPN) detected slightly enlarged lymphatic vessels (arrows). (G) Human duodenum sections derived from same patient as in F and an unaffected control were subjected to immunofluorescence staining. Selected magnifications (framed areas) depict staining for Hoechst (brown; right column, second and fourth images), E-cadherin (yellow; middle column, first and third images), PDPN (magenta; right column, first and third images), CD31 (cyan; middle column, second and fourth images). Scale bars: 100 μm. Immunofluorescence staining revealed significantly reduced lymphatic vessel density compared with healthy control samples based on PDPN-positive area per mm2 tissue area. Two-tailed Student’s t test; **P < 0.01. E is a historical standard taken from authors’ archive: “Methods of Imaging the Lymphatic System” by City St George’s University of London licensed under CC BY-SA-4.0 (59).
|