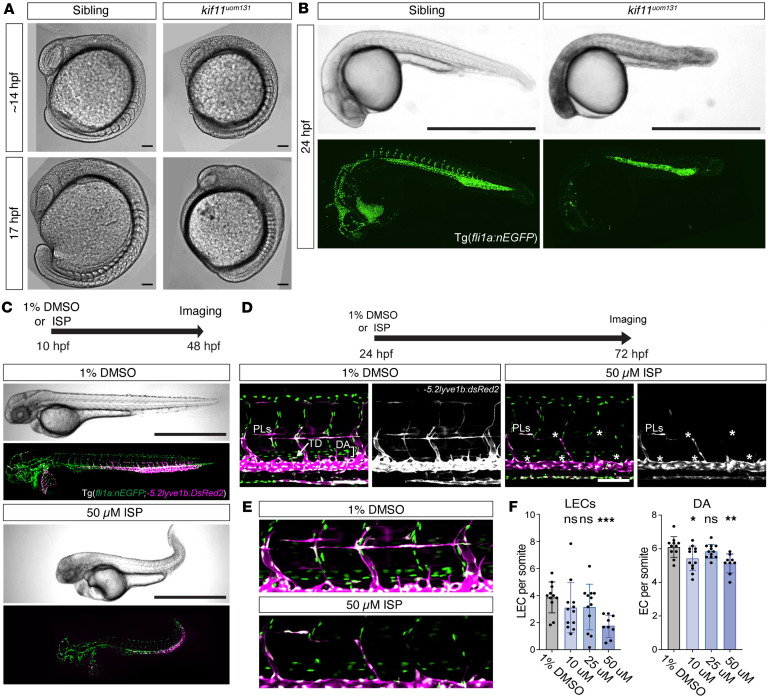
IMAGE

Figure 6

ID
ZDB-IMAGE-260215-150
Genes
Source
Figures for Ogmen et al., 2025
Image
Figure Caption

Figure 6 Genetic and pharmacological loss of kif11 results in abnormal embryonic and vascular development in zebrafish.

(A) Differential inference contrast images of 14 and 17 hpf sibling (kif11+/+or+/uom131) and mutant embryos (kif11uom131). Somite defects, brain necrosis, and aberrant tail development observable in 100% of mutants at both time points (n = 8/8 mutants and n = 0/19 sibling at 14 hpf and n = 8/8 mutants and n = 0/7 sibling at 17 hpf). Scale bar: 100 μm. (B) Upper: brightfield images of sibling and mutant embryos at 24 hpf. Brain necrosis and reduced embryo size observable in mutants. Lower: confocal maximum projection images of Tg(fli1a:nEGFP) embryos showing reduced intersegmental vessel sprouting and vascular development likely consistent with delayed embryonic development (n = 26/26 mutants and n = 0/88 sibling). Scale bar: 1 mm. (C) Brightfield and confocal maximum projection images of DMSO control (upper) and treated (lower) embryos following exposure to 50 μM ispinesib (ISP) at 10–48 hpf. Tg(fli1a:nEGFP;lyve1b:DsRed2) used to visualize ECs, veins, and lymphatic progenitors (PL). ISP treatment caused brain necrosis, pericardial edema, and aberrant tail development (n = 26/26 ISP-treated, n = 27 1% DMSO). Scale bar: 1 mm. (D) Confocal maximum projection images of DMSO control or 50 μM ISP-treated Tg(fli1a:nEGFP;lyve1b:DsRed2) embryos at 72 hpf. ISP treatment 24 –72 hpf; 50 μM ISP-treated embryos showed impaired PL formation at horizontal myoseptum (quantified in E). Scale bar: 100 μm. (E) Zoomed images of DA and PLs from D. (F) Bar plots of EC numbers (per somite) in DA and PLs treated with increasing ISP concentrations (n = 11, 1% DMSO; n = 12, 10 μM ISP; n = 12, 25 μM ISP, n = 9, 50 μM ISP). Reductions in LECs and DA ECs were observed. Unpaired Student’s t test for normally distributed data and Mann-Whitney U test for non-normally distributed data. *P = 0.0261; **P = 0.0018; ***P = 0.0002; ns, nonsignificant. TD, thoracic duct; DA, dorsal aorta; EC, endothelial cell.

Figure Data
Acknowledgments
This image is the copyrighted work of the attributed author or publisher, and ZFIN has permission only to display this image to its users. Additional permissions should be obtained from the applicable author or publisher of the image. Full text @ JCI Insight