|
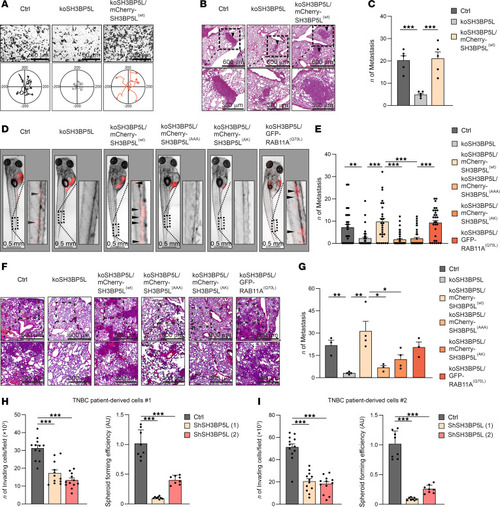
SH3BP5L enhances RAB11A-mediated invasion and metastasis. (A) Representative image of Transwell (upper) and single-cell tracking (bottom) assay of MDA-MB-231 cells KO for SH3BP5L cells and transfected with mCherry-SH3BP5L(WT) (koSH3BP5L/mCherry-SH3BP5L(WT)). For cell tracking, n = 25 (Ctrl), n = 36 (koSH3BP5L), n = 21 (koSH3BP5L/mCherry-SH3BP5L(WT)) cells, respectively. Scale bars: 600 μm and 300 μm (enlarged insets). (B and C) Representative images (B) and relative quantification (C) of H&E staining of lung metastases in NSG mice injected in the tail vein with koSH3BP5L in MDA-MB-231 cells and transfected with mCherry-SH3BP5L(WT) (koSH3BP5L/mCherry-SH3BP5L(WT)). Black arrowheads indicate metastatic foci. Each dot in the graph in C is representative of an injected mouse (n = 5). Scale bars: 60 μm. (D and E) Representative images (D) and relative quantification (E) of metastasized foci in zebrafish injected with MDA-MB-231 cells with koSH3BP5L and transfected with mCherry-SH3BP5L(WT) (koSH3BP5L/SH3BP5L(WT)), mCherry-SH3BP5L(AAA) (koSH3BP5L/SH3BP5L(AAA)), mCherry-SH3BP5L(AK) (koSH3BP5L/SH3BP5LAK), or GFP-RAB11A(Q70L) (koSH3BP5L/RAB11AQ70L). Arrowheads indicate metastatic foci in zebrafish tails. Each dot in the graph in E is representative of an injected zebrafish (n ≥30). Scale bars: 0.5 mm. (F and G) Representative images (F) and relative quantification (G) of H&E staining of lung metastases in NSG mice orthotopically injected with MDA-MB-231 cells with koSH3BP5L and transfected with mCherry-SH3BP5L(WT) (koSH3BP5L/SH3BP5L(WT)), mCherry-SH3BP5L(AAA) (koSH3BP5L/SH3BP5L(AAA)), mCherry-SH3BP5L(AK) (koSH3BP5L/SH3BP5L(AK)), or GFP-RAB11A(Q70L) (koSH3BP5L/RAB11A(Q70L)). Each dot in the graph in G is representative of an injected mouse (n ≥3). Scale bars: 600 μm and 300 μm (enlarged insets). (H and I) In vitro Matrigel Transwell invasion assay (left) and spheroid-forming assay (right) of cells derived from 2 patients with TNBC (patient 1, H; patient 2, I) transduced with either control or 2 independent lentiviral shRNAs targeting SH3BP5L (left; n = 12 fields per group from 3 independent experiments; right: n = 8). Data represent the mean of at least 3 independent experiments ± SEM. *P < 0.05, **P < 0.01, and ***P < 0.005, by 1-way ANOVA.
|