|
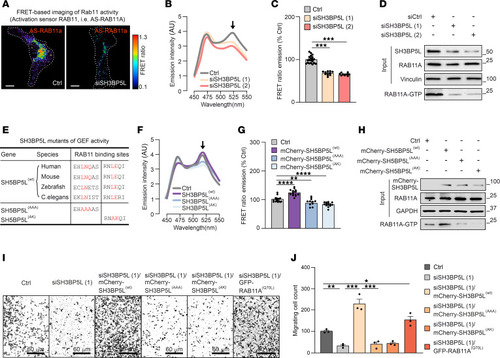
SH3BP5L affects RAB11A activation. (A) Representative pseudocolored confocal image of the FRET ratio in MDA-MB-231 cells transfected with SH3BP5L-silenced AS-RAB11A. Scale bars: 5 μm. (B) Spectrophotometry assay quantification of FRET ratio emission intensity in lysate obtained from HEK293T cells transfected with AS-RAB11A FRET sensor and SH3BP5L siRNAs. n ≥6 independent experiments. (C) Quantification of the FRET ratio from confocal image analysis of MDA-MB-231 cells transfected with AS-RAB11A sensor and SH3BP5L siRNAs. n ≥9 cells. (D) Representative Western blot of endogenous RAB11-GTP content measured with a RAB11 activation pull-down assay using GST-RAB11FIP3 (specifically binds to the active GTP loaded form of RAB11A) in SH3BP5L-depleted MDA-MB-231 cells. (E) Table representing SH3BP5L conserved regions for the binding of RAB11A and the overlapping putative SH3BP5L amino acid residues. (F) Spectrophotometry assay quantification of FRET ratio emission intensity in lysate obtained from HEK293T cells transfected with AS-RAB11A FRET sensor and mCherry-SH3BP5L(WT), mCherry-SH3BP5L(AAA), or mCherry-SH3BP5L(AK) constructs. n ≥7 independent experiments. (G) Quantification of the FRET ratio from confocal image analysis of MDA-MB-231 cells transfected with AS-RAB11A sensor and mCherry-SH3BP5L(WT), mCherry-SH3BP5L(AAA), or mCherry-SH3BP5L(AK) constructs. n ≥10 cells. (H) Representative Western blot of endogenous RAB11-GTP content measured with a RAB11 activation pull-down assay using GST-RAB11FIP3 (specifically binds to the active GTP-loaded form of RAB11A) in MDA-MB-231 cells transfected with mCherry (Ctrl), mCherry-SH3BP5L(WT), mCherry-SH3BP5L(AAA), or mCherry-SH3BP5L(AK) constructs. (I and J) Representative crystal violet staining (I) and relative quantification (J) of a Transwell assay of MDA-MB-231 cells depleted of SH3BP5L (siSH3BP5L) and transfected with mCherry-SH3BP5L(WT), mCherry-SH3BP5L(AAA), mCherry-SH3BP5L(AK), or constitutively active GFP-RAB11A(Q70L) constructs. Transfection efficiency was confirmed separately, with at least 70% of cells fluorescently labeled. Scale bars: 60 μm (I). Data represent the mean of at least 3 independent experiments ± SEM. *P < 0.05, **P < 0.01, and ***P < 0.005, by 1-way ANOVA. Ctrl, control.
|