|
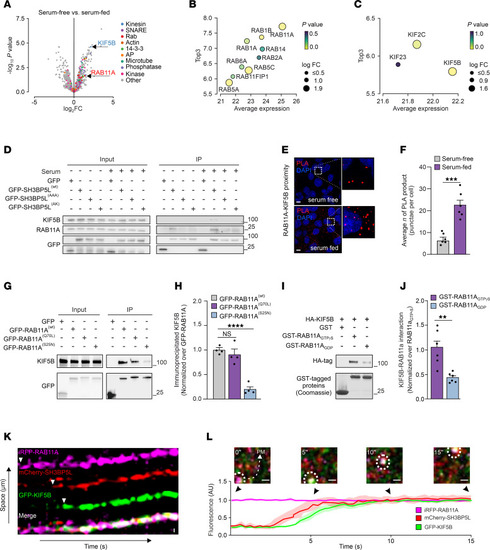
SH3BP5L interacts with KIF5B to recycle cargo back to the plasma membrane. (A) Volcano plot of mass spectrometry analysis performed from GFP immunoprecipitation of HEK293T cells transfected with GFP or GFP-SH3BP5L in the control (serum-free) or recycling (serum-fed) condition. (B and C) Bubble plot illustrating the relationship between the average expression and Top3 metric for (B) RAB and (C) kinesin family proteins. Bubble size represents the log fold change (log FC), and bubble color corresponds to the P value. (D) Representative Western blot of GFP immunoprecipitation performed in HEK293T cells transfected with GFP, GFP-SH3BP5L(WT), GFP-SH3BP5L(AAA) , or GFP-SH3BP5L(AK) constructs in serum-starved or -fed conditions. (E and F) Representative confocal images (E) and quantification (F) of a PLA for RAB11A and KIF5B in MDA-MB-231 cells. n = 6 images for each group from 3 independent experiments. Scale bars: 5 μm. (G and H) Representative Western blots (G) and relative quantification (H) of GFP immunoprecipitation performed on HEK293T cells transfected with GFP, GFP-RAB11A(WT), GFP-RAB11AQ70L, or GFP-RAB11A(S25N) constructs. (I and J) Representative Western blots (I) and relative quantification (J) of a pull-down assay for GST-RAB11A loaded with GDP or GTPγS performed on HEK293T cells transfected with HA-KIF5B. (K) Kymograph of fluorescence intensity for mCherry-SH3BP5L (red) and GFP-KIF5B (green) along an iRFP-RAB11A-labeled (magenta) vesicle over time. Merge shows the colocalization dynamics. (L) Representative image of the vesicle positive for iRFP-RAB11A, mCherry-SH3BP5L, and GFP-KIF5B (top) showing its transport toward the plasma membrane (PM). Quantification of relative fluorescence intensity over time for iRFP-RAB11A, mCherry-SH3BP5L, and GFP-KIF5B, with shaded regions indicating standard deviation (bottom). Scale bars: 1 μm. Data represent the mean of at least 3 independent experiments ± SEM. **P < 0.01, ***P < 0.005, and ****P < 0.001, by 1-way ANOVA.
|