|
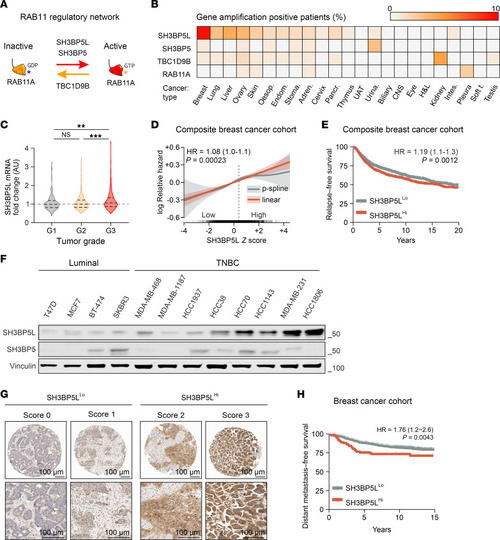
SH3BP5L expression in BC and association with patient outcomes. (A) Schematic representation of the RAB11 regulatory network. RAB11-GDP is activated by its GEFs, SH3BP5L and SH3BP5, and inactivated by its GAP, TBC1D9B. (B) Copy number alterations of SH3BP5L, SH3BP5, TBC1D9B, and RAB11A across cancer types in TCGA database. Adren., adrenal gland; Oesop., esophagus; Endom., endometrium; Stoma., stomach; Pancr., pancreas; UAT, upper aerodigestive tract; Urina., urinary tract; H&L, hematopoietic and lymphoid; Intes., large intestinal; Soft t., soft tissue. (C) Violin plot showing SH3BP5L mRNA expression across tumor grades in the METABRIC dataset (n = 1,893). **P = 0.002 and ***P < 0.001, by Wilcoxon–Mann-Whitney U test. (D and E) Association of SH3BP5L expression with RFS in a composite BC cohort. (D) Continuous analysis of the log relative hazard against SH3BP5L expression. Both a linear fit (red) and a penalized spline fit (gray) are shown. The HR and log-rank test P value refer to the linear term. Shaded areas represent 95% CIs. Dashed line indicates the upper tertile cutoff. (E) Kaplan-Meier analysis of patients stratified according to SH3BP5Lhi (upper tertile) and SH3BP5Llo expression. P denotes the log-rank P value; n = 4,005. (F) Representative immunoblots of SH3BP5L and SH3BP5 expression normalized to vinculin in luminal and TNBC cell lines. (G) Immunohistochemical assessment of SH3BP5L expression in patients with BC (n = 1590). Representative images of SH3BP5Llo tumors (n = 1,470, score 0/1) and SH3BP5Lhi tumors (n = 120, score 2/3). Scale bars: 100 μm. (H) DMFS analysis of patients with SH3BP5Lhi versus SH3BP5Llo BC. P denotes the log-rank test P value; n = 1,590.
|