|
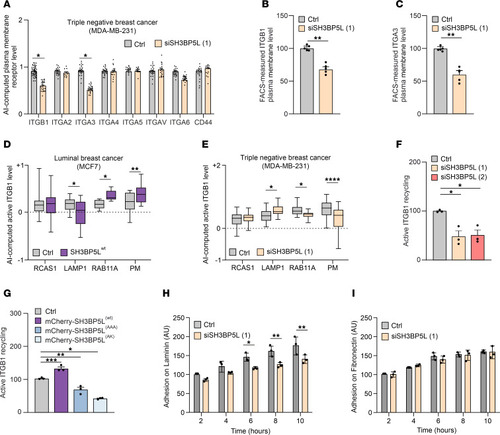
SH3BP5L boosts ITGB1 recycling. (A) AI-driven quantification of different integrin subunits and CD44 at the plasma membrane of MDA-MB-231 cells upon SH3BP5L depletion. n ≥12 cells from 3 independent experiments. (B and C) FACS quantification of plasma membrane ITGB1 (B) and ITGA3 (C) in MDA-MB-231 cells upon SH3BP5L depletion. (D) AI-driven quantification of active ITGB1 (with mAb 9EG7) subcellular distribution in MCF7 cells overexpressing SH3BP5L(WT). n = 22 control cells, n = 18 SH3BP5L(WT) cells. (E) AI-driven quantification of active ITGB1 (mAb 9EG7) subcellular distribution in MDA-MB-231 cells depleted of SH3BP5L. n = 43 control cells, n = 37 siSH3BP5L cells. (F and G) FACS quantification of active ITGB1 (mAb 9EG7) recycling at 30 minutes in MDA-MB-231 cells transfected with 2 different SH3BP5L siRNAs or (F) with mCherry, mCherry-SH3BP5L(WT), mCherry-SH3BP5L(AAA), or mCherry-SH3BP5L(AK) constructs (G). (H and I) Real-time adhesion assay of MDA-MB-231 cells transfected with control or SH3BP5L siRNA and seeded on laminin (H) or fibronectin (I). Data represent the mean of at least 3 independent experiments ± SEM. *P < 0.05, **P < 0.01, ***P < 0.005, and ****P < 0.001, by 1- or 2-way ANOVA followed by Bonferroni post hoc test as appropriate.
|