|
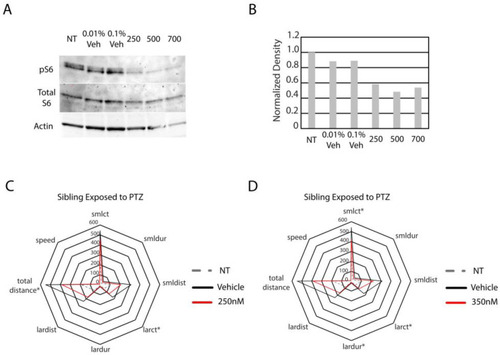
Optimization of torin1 treatment and PTZ response in wildtype animals treated with torin1. (A) Western blot with anti-phosphorylated ribosomal S6 protein, total S6 protein, and actin was performed on non-treated (NT), vehicle-treated (different percentages), and the indicated concentrations of torin1 (250 nM). For analysis in (A), 25 animals were harvested/group. (B) Quantification of (A). Subsequently, animals were treated with 250 nM (C) or 350 nM (D) torin1 and then exposed to 1 µM PTZ. For the analysis shown in (C), animal numbers are as follows: NT (N = 22), vehicle-treated (N = 20), and 250 nM (N = 19). Star plots were developed to analyze all parameters obtained directly from Zebralab software version 3.22. Asterisks indicate statistical significance (p < 0.05). For the analysis shown in (D), animal numbers are as follows: NT (N = 22), vehicle-treated (N = 20), and 350 (N = 18). For (C,D) * indicates p < 0.05.
|