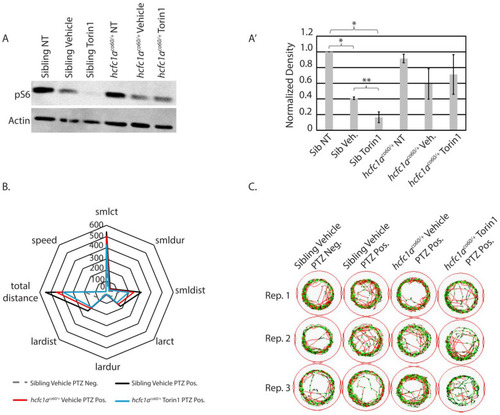
Effects of 250 nM torin1 treatment on pS6 and behavior. (A) Western blot was used to detect the phosphorylation of S6 ribosomal protein (pS6) in non-treated (NT), vehicle-treated (0.1% DMSO), or torin1-treated (250 nM) wildtype siblings or hcfc1aco/60/+ larvae. Actin is used as a loading control, and an additional ponceau stain was performed. N = 14 larvae/group. (A’) Normalized density for Western blot detection, representing two biological replicates, was performed using Photoshop). The second Western blot is shown in Figure S2. Error bars represent the standard error of the mean. * p < 0.05, and ** p = 0.07. (B) Radar plot analyzing 8 parameters collected using ZebraBox technology in larvae treated with vehicle or torin1 and exposed to 1 µM PTZ (seizure-inducing). Comparison is provided for animals with no PTZ exposure (neg) and those with PTZ exposure (pos). (C) Sample trace patterns from the animals in (B). The trace patterns are examples from 3 independent replicates obtained from different parents on different days. Abbreviations: Rep. 1, 2, or 3 refers to biological replicate 1, 2, or 3. Colors in the trace patterns are equivalent to the key shown in Figure 1.
|
