FIGURE

Figure 1

ID
ZDB-FIG-260124-1
Publication
Gil et al., 2025 - A Zebrafish Seizure Model of cblX Syndrome Reveals a Dose-Dependent Response to mTor Inhibition
Other Figures
All Figure Page
Back to All Figure Page
Figure 1

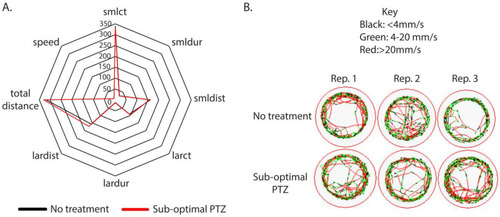
Empirical derivation of a sub-optimal concentration of PTZ. (A,B) Wildtype larvae (5 days post-fertilization) were individually placed in a 48-well dish and acclimated for 1 h at room temperature to the ZebraBox self-contained environment. Individual larvae were monitored for 5 min in dark conditions to obtain a baseline behavior. After recording the baseline behavior, larvae were exposed to pentylenetetrazol (0.001 pM). A representative radar plot was used to analyze all parameters simultaneously. (A). Black lines in the radar plot represent animals that were untreated (no PTZ), and red lines indicate animals that were treated with 0.001 pM PTZ. Representative trace patterns are shown (B). Abbreviations: Rep: Replicate. Representative trace patterns are from 3 independent biological replicates. The total number of animals (48) was obtained from 3 independent replicates.

Expression Data

Expression Detail
Antibody Labeling
Phenotype Data

Phenotype Detail
Acknowledgments
This image is the copyrighted work of the attributed author or publisher, and ZFIN has permission only to display this image to its users. Additional permissions should be obtained from the applicable author or publisher of the image. Full text @ J Dev Biol