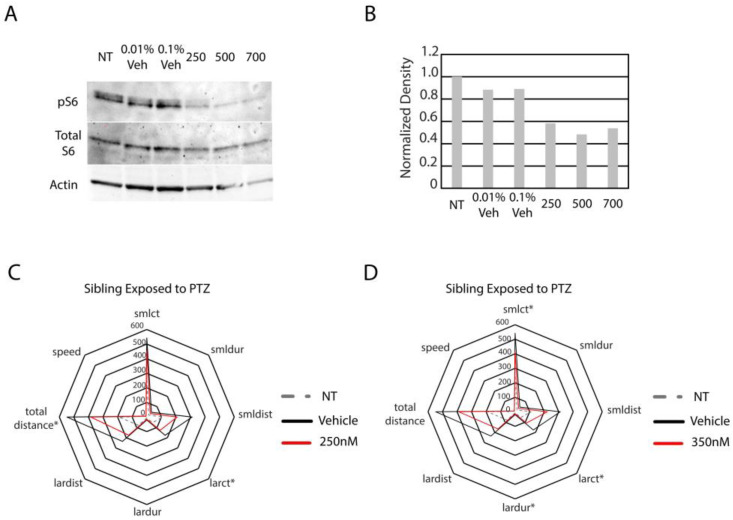
IMAGE

Figure 3

ID
ZDB-IMAGE-260124-4
Antibodies
Source
Figures for Gil et al., 2025
Image
Figure Caption

Figure 3

Optimization of torin1 treatment and PTZ response in wildtype animals treated with torin1. (A) Western blot with anti-phosphorylated ribosomal S6 protein, total S6 protein, and actin was performed on non-treated (NT), vehicle-treated (different percentages), and the indicated concentrations of torin1 (250 nM). For analysis in (A), 25 animals were harvested/group. (B) Quantification of (A). Subsequently, animals were treated with 250 nM (C) or 350 nM (D) torin1 and then exposed to 1 µM PTZ. For the analysis shown in (C), animal numbers are as follows: NT (N = 22), vehicle-treated (N = 20), and 250 nM (N = 19). Star plots were developed to analyze all parameters obtained directly from Zebralab software version 3.22. Asterisks indicate statistical significance (p < 0.05). For the analysis shown in (D), animal numbers are as follows: NT (N = 22), vehicle-treated (N = 20), and 350 (N = 18). For (C,D) * indicates p < 0.05.

Figure Data
Acknowledgments
This image is the copyrighted work of the attributed author or publisher, and ZFIN has permission only to display this image to its users. Additional permissions should be obtained from the applicable author or publisher of the image. Full text @ J Dev Biol