FIGURE

Figure 1

ID
ZDB-FIG-251226-7
Publication
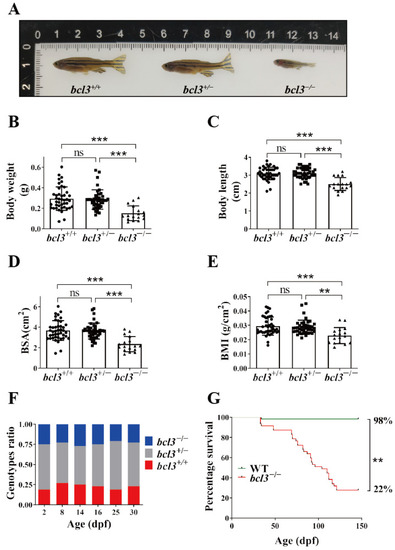
Fan et al., 2025 - Bcl3 Deficiency Leads to Hyperinflammation in Zebrafish
Other Figures
All Figure Page
Back to All Figure Page
Figure 1

Phenotypes of bcl3−/− zebrafish. (A) Representative images of bcl3+/+, bcl3+/, and bcl3−/ zebrafish at 4 months old. (B) Body weight, (C) body length, (D) body surface area (BSA), and (E) body mass index (BMI) of bcl3+/+, bcl3+/, and bcl3−/ zebrafish. BSA was defined by: BSA (cm2) = 8.46 × (body weight (g))0.66; BMI was calculated as body weight (g) divided by body length square (cm2). Body length data were normally distributed and analyzed using one-way ANOVA followed by Tukey’s post hoc test; whereas body weight data, BSA, and BMI values did not meet normality assumptions and were analyzed using the Kruskal–Wallis test with Holm-corrected Mann–Whitney U post hoc comparisons. (F) Genotype ratio of bcl3+/+, bcl3+/, and bcl3−/ larvae at indicated dpf. At each time point, 48 larvae were genotyped. (G) Survival curves of zebrafish WT and bcl3−/ from 35 to 150 dpf, analyzed using the log-rank (Mantel–Cox) test. *** p < 0.001, ** p < 0.01, ns indicates not significant. Error bars represent standard deviation (SD).

Expression Data

Expression Detail
Antibody Labeling
Phenotype Data
Fish:
Observed In:
Stage Range: Days 30-44 to Adult

Phenotype Detail
Acknowledgments
This image is the copyrighted work of the attributed author or publisher, and ZFIN has permission only to display this image to its users. Additional permissions should be obtained from the applicable author or publisher of the image. Full text @ Cells