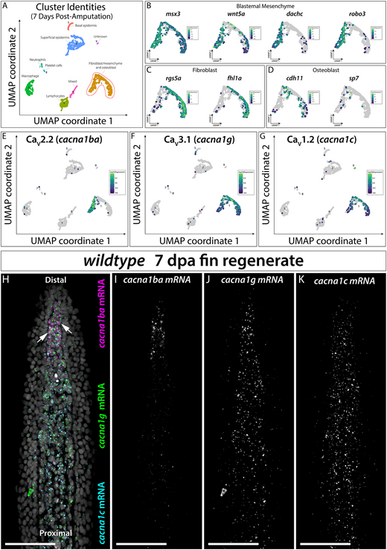
L-, N- and T-type voltage Ca2+ channels are expressed in fibroblast-lineage blastemal cells. (A) Uniform manifold approximation and projection (UMAP) showing cells from 7 day post amputation (dpa) scRNA-seq caudal fin tissue projected in nine clusters annotated using established markers (see Fig. S1) (Lewis et al., 2023). The red dashed line outlines the cluster containing fibroblast- and osteoblast-lineage cells. (B-D) UMAPs of cluster 3 highlighting the indicated transcripts with known, elevated expression in (B) blastemal mesenchyme, (C) fibroblasts, and (D) osteoblasts. (E-G) UMAPs showing specific expression of the α1 subunit voltage-gated Ca2+ channels genes cacna1ba (E; N-type), cacna1g (F; T-type) and cacna1c (G; L-type) in the fibroblast/osteoblast cluster. (H-K) 7 dpa longitudinal section of a regenerating caudal fin stained by RNAscope for cacna1ba (magenta), cacna1g (green) and cacna1c (cyan) transcripts. The white arrows indicate cacna1ba, cacna1c and cacna1g co-expressing distal blastema cells. Hoechst-stained nuclei are marked in gray. Individual max intensity projections for cacna1ba (I), cacna1g (J) and cacna1c (K) mRNA are shown in grayscale. Data in H are also shown in Fig. S4A. Scale bars: 50 µm.
|
