|
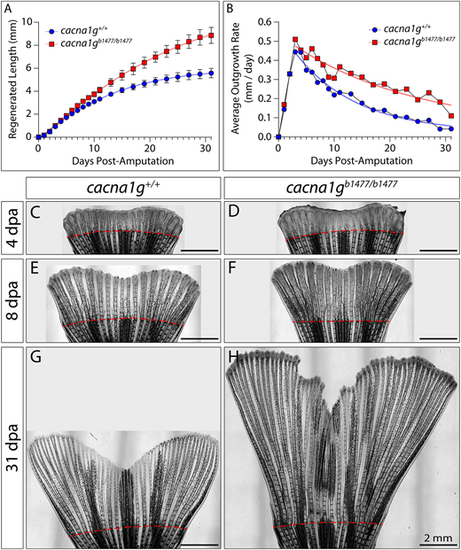
Cacna1g decelerates regenerating fin outgrowth to restore fin size. (A,B) Graphs showing (A) regenerated caudal fin lengths and derived (B) outgrowth rates of cacna1g+/+ (blue circles) and cacna1gb1477/b1477 (red squares) fish over 31 days of regeneration. (A) Sigmoidal logistic growth curves are fit to regenerated fin lengths over time to reflect an initial delay for blastema establishment and then a progressively slowing outgrowth rate. Means±s.d. are plotted for each timepoint (n=14 for each genotype). (B) One phase exponential decay curves are fit to the average outgrowth rates starting at the peak outgrowth rate at 3 dpa. Means are shown across the time course (n=14 for each genotype). (C-H) Bright-field stitched images of 4, 8 and 31 dpa regenerated caudal fins of representative cacna1g+/+ and cacna1gb1477/b1477 fish. Scale bars: 2 mm.
|