
FIGURE
Figure 3
- ID
- ZDB-FIG-251125-11
- Publication
- Toso et al., 2025 - Human and zebrafish mineralocorticoid receptors reporter cell assays to assess the activity of chemicals
- Other Figures
- All Figure Page
- Back to All Figure Page
Figure 3
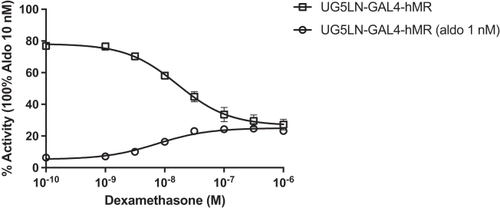
Dose-response curves of dexamethasone in the absence or presence of aldosterone 10−9 M in HG5LN-GAL4-hMR cells Results are expressed as the percentage of the maximum luciferase activity induced by 10−8 M aldosterone. The curves are presented as a non-linear regression; log (ligand) versus response. EC50 and IC50 values (10−9 M) are shown in Data are presented as means ± SD values. n (replicates per experiment) = 4 per group. |
Expression Data
Expression Detail
Antibody Labeling
Phenotype Data
Phenotype Detail
Acknowledgments
This image is the copyrighted work of the attributed author or publisher, and
ZFIN has permission only to display this image to its users.
Additional permissions should be obtained from the applicable author or publisher of the image.
Full text @ iScience