|
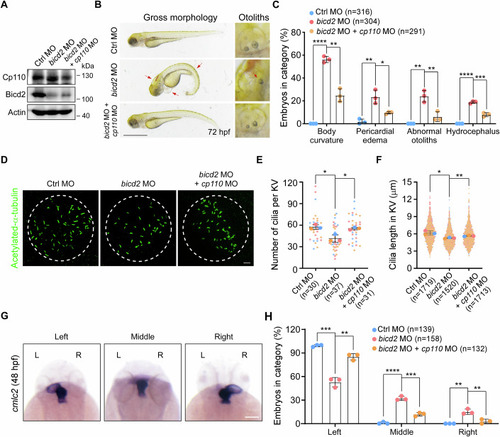
Depletion of Cp110 rescues the ciliary defects in bicd2 morphants. (A–H) Embryos were injected with the indicated MOs at the one-cell stage and harvested at different time points. Western blot analysis of Cp110 and Bicd2 proteins (A). Actin was used as a loading control. Representative images and quantification of gross morphology of embryos injected with the indicated MOs (B, C). Scale bar, 1 mm. Body curvature, P (1, Ctrl MO vs. bicd2 MO) < 0.0001, P (2, bicd2 MO vs. bicd2 MO + cp110 MO) = 0.001; Pericardial edema, P (1) = 0.0042, P (2) = 0.0171; Abnormal otoliths, P (1) = 0.0012, P (2) = 0.0095; Hydrocephalus, P (1) < 0.0001, P (2) = 0.0008. Immunofluorescence images of cilia in KVs stained with antibodies against acetylated-α-tubulin (D). The borders of KVs are indicated by white circular dotted lines. Scale bar, 10 µm. Quantification analyses of the number and length of cilia in KVs (E, F). Cilia number, P (1, Ctrl MO vs. bicd2 MO) = 0.0105, P (2, bicd2 MO vs. bicd2 MO + cp110 MO) = 0.0117; Cilia length, P (1) = 0.012, P (2) = 0.0094. Whole-mount in situ hybridization images of embryos incubated with the cmlc2 probe (G). Scale bar, 100 µm. Quantification analysis of the expression patterns of cmlc2 (H). Left, P (1, Ctrl MO vs. bicd2 MO) = 0.0002, P (2, bicd2 MO vs. bicd2 MO + cp110 MO) = 0.0014; Middle, P (1) < 0.0001, P (2) = 0.0006; Right, P (1) = 0.0014, P (2) = 0.0083. n, number of embryo samples (C, E, H) or number of cilia (F). Data were shown as mean ± SD from three independent biological repeats. Student’s t-test; *P < 0.05, **P < 0.01, ***P < 0.001, ****P < 0.0001. Source data are available online for this figure.
|