|
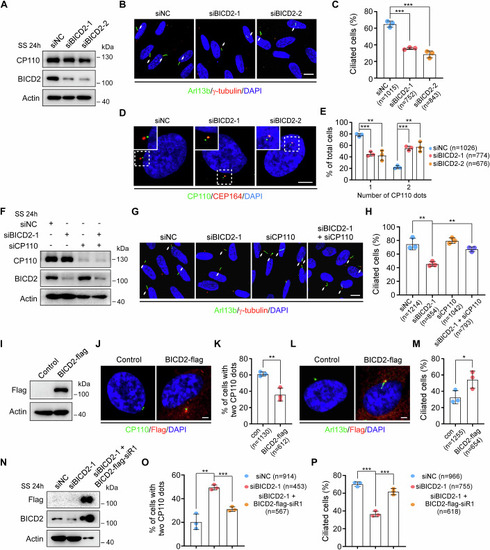
BICD2 promotes CP110 removal during ciliogenesis. (A–E) RPE-1 cells transfected with negative control (NC) or BICD2 siRNAs for 48 h were treated with serum starvation (SS) for an additional 24 h, and then subjected to Western blotting or immunofluorescence. Western blot analysis of CP110 and BICD2 proteins (A). Confocal images of RPE-1 cells stained with anti-Arl13b and anti-γ-tubulin antibodies (B). Cilia are indicated by white arrows. Scale bar, 10 μm. Quantification analysis of the percentage of ciliated cells (C). P (siNC vs. siBICD2-1) = 0.0002, P (siNC vs. siBICD2-2) = 0.0004. Immunofluorescence images of RPE-1 cells stained with antibodies against CP110 and CEP164 (D). Scale bar, 5 μm. Quantification analysis of the percentage of cells with the indicated number of CP110 foci (E). One CP110 dot, P (1, siNC vs. siBICD2-1) = 0.0003, P (2, siNC vs. siBICD2-2) = 0.0026; Two CP110 dots, P (1) = 0.0003, P (2) = 0.0026. (F–H) RPE-1 cells transfected with the indicated siRNAs for 48 h were treated with serum starvation for another 24 h, and then applied for Western blotting or immunofluorescence. Immunoblotting of the indicated proteins (F). Confocal images of RPE-1 cells stained with anti-Arl13b and anti-γ-tubulin antibodies (G). Cilia are indicated by white arrows. Scale bar, 10 μm. Quantification analysis of the percentage of ciliated cells (H). P (siNC vs. siBICD2-1) = 0.0054, P (siBICD2-1 vs. siBICD2-1 + siCP110) = 0.0016. (I–M) RPE-1 cells cultured in normal serum medium were infected with lentiviruses carrying the indicated plasmids for 48 h, followed by puromycin treatment for an additional 48 h. The cells were then subjected to Western blotting or immunofluorescence. Western blot analysis of Flag protein (I). Representative confocal images of RPE-1 cells stained with anti-CP110 and anti-Flag antibodies (J), or with anti-Arl13b and anti-Flag antibodies (L). Scale bars, 2 μm. Quantification analyses of the percentage of cells with two CP110 dots (K), or ciliated cells (M) in the control and Flag-positive groups. Two CP110 dots (K), P (con vs. BICD2-flag) = 0.0065; Ciliated cells (M), P (con vs. BICD2-flag) = 0.0473. (N–P) RPE-1 cells transfected with control or BICD2 siRNAs for 24 h were infected with lentivirus carrying the siRNA-resistant wild-type BICD2-flag for 48 h, followed by serum starvation for an additional 24 h. The cells were then subjected to Western blotting or immunofluorescence. Western blot analysis of CP110 and BICD2 proteins (N). Quantification analyses of the percentage of cells with two CP110 dots (O), or ciliated cells (P) in the indicated siRNA groups and Flag-positive group. Two CP110 dots (O), P (1, siNC vs. siBICD2-1) = 0.002, P (2, siBICD2-1 vs. siBICD2-1 + BICD2-flag-siR1) = 0.0004; Ciliated cells (P), P (1) = 0.0001; P (2) = 0.0007. Actin was served as a loading control. DNA was stained by DAPI. n, the number of total cells calculated. Data were presented as mean ± SD from three independent biological repeats. Student’s t-test; *P < 0.05, **P < 0.01, ***P < 0.001. Source data are available online for this figure.
|