
Image
|
Figure Caption
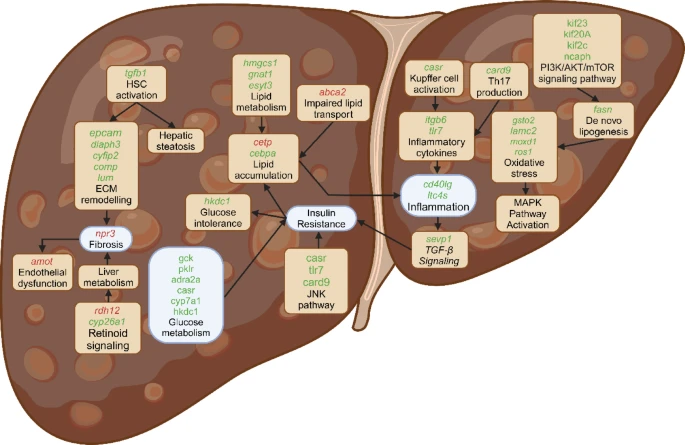
Fig. 8 Comparison of human and zebrafish MAFLD models: Genes elevated in both models are highlighted in green, while downregulated genes are highlighted in red.
Acknowledgments
This image is the copyrighted work of the attributed author or publisher, and
ZFIN has permission only to display this image to its users.
Additional permissions should be obtained from the applicable author or publisher of the image.
Full text @ Sci. Rep.