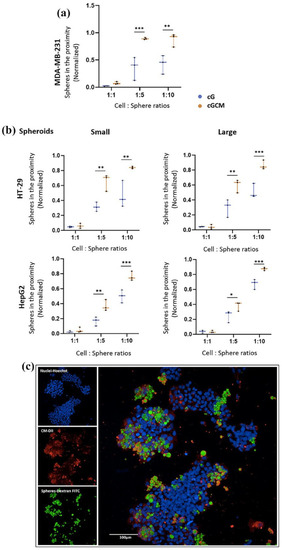
In vitro interaction studies of gelatin microspheres (cG) and NK cell mimics (cGCM) with 2D cultures of MDA-MB-231 (human breast cancer cell line) and 3D spheroids of HT-29 (human colon cancer cell line) and HepG2 (human liver cancell cell line) using various cell: sphere ratios (1:1, 1:5, 1:10, 1:20) after 24 h incubation: (a) comparative analysis of number of cG and cGCM interacting or in the close proximity with the MDA-MB-231(One-way ANOVA, cG vs cGCM (1:5), p = 0.0003, 95% CI = −0.8344 to −0.2330; cG vs cGCM (1:10), p = 0.0018, 95% of CI: −0.7513 to −0.1499), N = 3, (b) comparative analysis of number of cG and cGCM in close proximity to spheroids of HT-29 small spheroid (one-way ANOVA, cG vs cGCM (1:5), p = 0.0019, 95% CI = −0.5650 to −0.115; cG vs cGCM (1:10), p = 0.0014, 95% CI: −0.5752 to −0.1216); HT- 29 large spheroid (one-way ANOVA, cG vs cGCM (1:5), p = 0.0011, 95% CI = −0.4875 to −0.1083; cG vs cGCM (1:10), p = 0.0002, 95% CI: −0.5436 to −0.1644), and HepG2 small spheroid (one-way ANOVA, cG vs cGCM (1:5), p = 0.0040, 95% CI = −0.3505 to −0.05568; cG vs cGCM (1:10), p = 0.0010, 95% CI: −0.4110 to −0.1162); HepG2 large spheroid (one-way ANOVA, cG vs cGCM (1:5), p = 0.0325, 95% CI = −0.2586 to −0.008217; cG vs cGCM (1:10), p = 0.0010, 95% CI: −0.3244 to −0.07408), N = 3; *p < 0.05, **p < 0.01, ***p < 0.001, ****p < 0.0001, and (c) representative 2D image of interaction of cGCM with HT-29, 1:5 (cell: sphere ratio), NK cell membrane was tagged with CM-DiI dye, NK cell mimics were loaded with dextran-FITC, and nuclei of HT-29 with Hoechst, Scale bar = 100 μm. Graphs are plotted in box and whiskers format with max and min value showing all data points.
|
