FIGURE

Figure 1.

ID
ZDB-FIG-251004-3
Publication
Chugh et al., 2025 - Design of an artificial natural killer cell mimicking system to target tumour cells
Other Figures
All Figure Page
Back to All Figure Page
Figure 1.

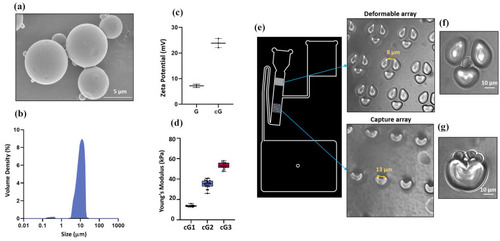
Characterization of gelatin microspheres: (a) field emission scanning electron microscopic (FESEM) image cross-linked gelatin microspheres (cG) using 50 mM DMTMM, scale bar = 5 μm, (b) size distribution of cG by laser diffraction, (c) surface charge on gelatin microspheres before crosslinking (G) and after crosslinking (cG) using zetasizer (N = 3), Error bars represent standard deviations, (d) Young’s modulus estimation of gelatin hydrogels cross-linked with 10, 50, and 100 mM DMTMM, termed as cG1, cG2, cG2 respectively, N = 3, Error bars represent standard deviations, (e) design of microfluidics chip, consists of deformability array with gap sizing of 8 μm, and capture array with v-cup sizing of 13 μm, (f) representation of deformable gelatin microspheres (>8 μm) captured in the deformable array, scale bar = 10 μm, and (g) representation of aggregated spheres/smaller spheres/non-deformable spheres captured in V-cups, scale bar = 10 μm. Graphs are plotted in box and whiskers format with max and min value showing all data points.

Expression Data

Expression Detail
Antibody Labeling
Phenotype Data

Phenotype Detail
Acknowledgments
This image is the copyrighted work of the attributed author or publisher, and ZFIN has permission only to display this image to its users. Additional permissions should be obtained from the applicable author or publisher of the image. Full text @ J Tissue Eng