
Figure 8.
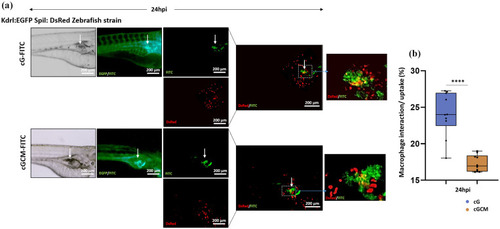
In vivo interaction/cellular uptake studies of gelatin microspheres (cG) and NK cell mimics (cGCM) with macrophages in zebrafish model: (a) microscopic images (bright field, red and green fluorescence) presenting the interaction at 24 h post injection (hpi) of dextran-FITC loaded gelatin microspheres (cG) and NK cell mimics (cGCM) with DsRed macrophages in 3 day post fertilized (dpf) Kdrl:EGFP Spil:DsRed Zebrafish strain model, Scale bar = 200 μm. The zebrafish embryos’ blood vessel were EGFP tagged, and spheres were FITC labelled. Therefore, both blood vessels and spheres were shown in the green channel. The background green fluorescence for the blood vessels was removed in Image J for analysis and marked the position of the spheres with white arrow for better analysis of the images to avoid the overlap of green channels, and (b) quantification of interaction/cellular uptake of cG and cGCM with macrophages at 24 hpi of spheres (unpaired Graphs are plotted in box and whiskers format with max and min value showing all data points. * |