FIGURE

Figure 7.

ID
ZDB-FIG-251004-10
Publication
Chugh et al., 2025 - Design of an artificial natural killer cell mimicking system to target tumour cells
Other Figures
All Figure Page
Back to All Figure Page
Figure 7.

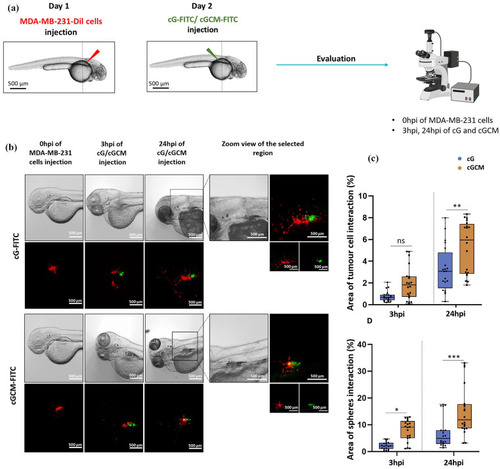
In vivo interaction studies with MDA-MB-231 (breast cancer cell line) in zebrafish xenograft breast tumour model: (a) schematics of the site and time of injection of MDA-MB-231 cells, dextran-FITC loaded gelatin microspheres and NK cell mimics, (b) microscopic images (bright field, red and green fluorescence) of same embryos at 0 h post injection (hpi) of MDA-MB-231 cells, at 3 and 24 hpi of dextran-FITC loaded gelatin microspheres (cG) and NK cell mimics (cGCM), Scale bar = 500 μm, Zoom view of the selected region is also presented for 24 hpi, Scale bar = 500 μm, (c) quantification of the interaction with respect to tumour cells (One-way ANOVA, cG vs cGCM (24 hpi), p = 0.0032, 95.00% CI = −3.496 to −0.5426), and (d) with respect to spheres (One way ANOVA, cG vs cGCM (3 hpi), p = 0.0131, 95% CI = −10.51 to −0.9147, cG vs cGCM (24 hpi), p = 0.0002, 95% CI = −12.73 to −3.131), N = 20.

Note. No cytotoxic payload was incorporated in these experiments, as the primary aim was to evaluate the interaction of NK cell mimics with tumour cells—specifically their attachment and spatial proximity—rather than inducing tumour cell death or inhibiting spheroid growth. Graphs are plotted in box and whiskers format with max and min value showing all data points.

*p < 0.05. **p < 0.01. ***p < 0.001. ****p < 0.0001.

Expression Data

Expression Detail
Antibody Labeling
Phenotype Data

Phenotype Detail
Acknowledgments
This image is the copyrighted work of the attributed author or publisher, and ZFIN has permission only to display this image to its users. Additional permissions should be obtained from the applicable author or publisher of the image. Full text @ J Tissue Eng