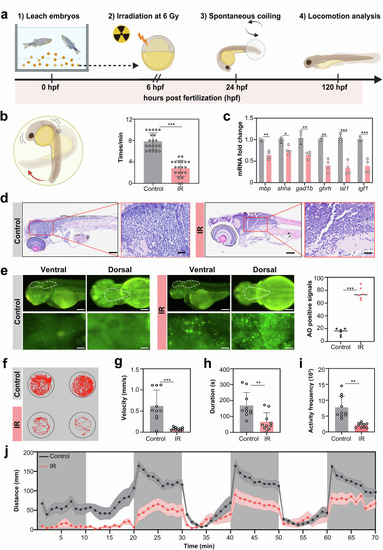
Radiation-induced neurodevelopmental deficits in zebrafish larvae. a Experimental timeline for radiation exposure and behavioral assessment. Embryos at 6 hpf were irradiated with 6 Gy γ rays (0.84 Gy/min, 7 min). Spontaneous coiling behavior was analyzed at 24 hpf, followed by locomotion analysis at 120 hpf. b Schematic illustration of spontaneous embryonic coiling patterns (a coiling event: tail bending ≥ 90°). Coiling frequency was quantified within 1-minute intervals (n = 20 embryos per group; Student’s t-test). c mRNA expression levels of neurodevelopment-related genes (mbp, shha, gad1b, ghrh, isl1, igf1) at 120 hpf (n = 4 biological replicates; Student’s t-test). d Representative hematoxylin‒eosin (HE) staining images showing whole-body morphology (left) and brain histology (right, boxed region magnified). e Apoptosis analysis via acridine orange (AO) staining. Ventral/dorsal views of AO fluorescence, including whole-body morphology (top) and the brain area (bottom, the white dashed-line region magnified). The number of apoptotic cells in the brain was quantified (n = 6 larvae per group; Student’s t-test). f–i Locomotion behavior analysis at 120 hpf during 10 min of adaptation. swimming trajectories (f); velocity (g); movement duration (h); activity frequency (i). j Locomotor distance of zebrafish larvae under alternating light‒dark cycles. After 10 min of dark adaptation, the zebrafish were subjected to three consecutive cycles of photoperiod stimulation (10 min light/10 min dark). The gray shaded areas indicate dark phases; the white areas denote light phases (f–j: n = 10 larvae; Student’s t test). All the statistical data are presented as the means ± SEMs. Scale bars: 500 μm (d, left), 50 μm (d, right), 200 μm (e, top), and 50 μm (e, bottom)
|
