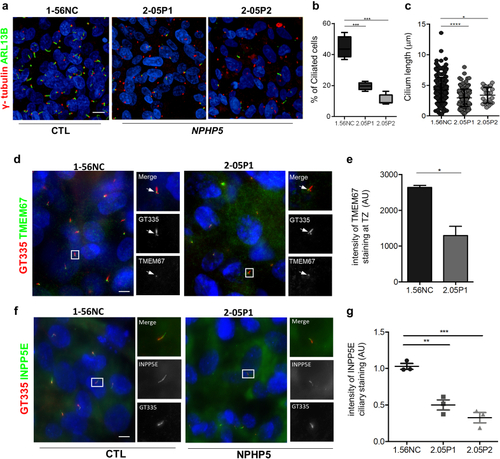
NPHP5 URECs show ciliogenesis and ciliary composition defects. (a–c) Control (1-56NC) and NPHP5 URECs (2.05P1, 2.05P2) grown in ciliogenesis conditions fixed and stained for primary cilia (ARL13B, green) and basal bodies (γ- tubulin, red) markers (a). (b) Ciliogenesis and (c) cilium length were quantified as in Figure 1. (b) n = 4 experiments; mixed linear-regression model with quasibinomial penalization: ∗∗∗P < 0.001. (c) n = 3 experiments; unpaired 2-tailed t test: ∗∗∗∗P < 0.0001; ∗P < 0.05. (d) Ciliated control (1.56.NC) and NPHP5 (2.05P1) URECs were fixed and stained for basal body and axoneme (GT335, red) and for TMEM67 (green), which is a marker of the transition zone (arrows). (e) TMEM67 staining intensity at the transition zone was quantified as detailed in Methods. n = 2 experiments; unpaired 2-tailed t test: ∗P < 0.05. (f) Ciliated control (1.56.NC) and NPHP5 (2.05P1) URECS were fixed and stained for basal body and axoneme (GT335, red) and for INPP5E (green). (g) Intensity of INPP5E staining in cilia was quantified as explained in Methods. n = 3 experiments; unpaired 2-tailed t test: ∗∗P < 0.01, ∗∗∗P < 0.001. Scale bars 10 μm. UREC, urinary renal epithelial cells.
|
