FIGURE

Figure 2

ID
ZDB-FIG-250816-55
Publication
Tata et al., 2025 - Prostaglandin Analogs and Eupatilin as Treatments for Nephronophthisis
Other Figures
All Figure Page
Back to All Figure Page
Figure 2

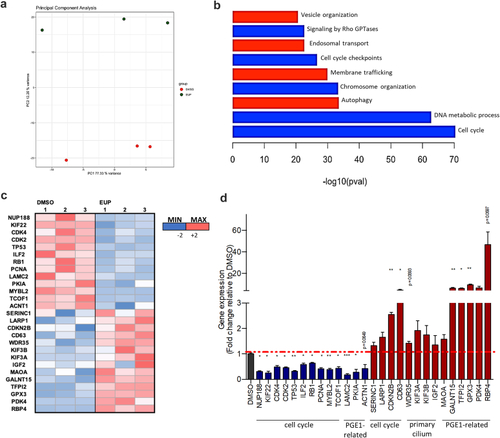
Transcriptomic analyses reveal the cellular pathways modulated in response to Eupatilin treatment. (a) Principal component analysis showing separation between the EUP-treated URECs and the DMSO-treated by PC2 variance. (b) Pertinent down (blue) or up (red) regulated pathways or relevant processes involving ciliary modulators dysregulated in NPHP1 URECs upon 24 hours of 20 μM EUP treatment were highlighted using Metascape. (c) Heatmap generated from qPCR results of 27 selected genes from RNA-seq dataset of NPHP1 URECs DMSO versus EUP. (d) RT-qPCR validating the effect of EUP treatment on the expression of 27 selected dysregulated genes in NPHP1 URECs. Mean ± SEM (n 0 = 3 experiments). Paired 2-tailed t test: ∗∗∗P < 0.001, ∗∗P < 0.01, ∗P < 0.05. Bars indicate mean ± SEM. DMSO, dimethyl sulfoxide; EUP, Eupatilin; ns, not significant; UREC, urinary renal epithelial cells.

Expression Data

Expression Detail
Antibody Labeling
Phenotype Data

Phenotype Detail
Acknowledgments
This image is the copyrighted work of the attributed author or publisher, and ZFIN has permission only to display this image to its users. Additional permissions should be obtained from the applicable author or publisher of the image. Full text @ Kidney Int Rep