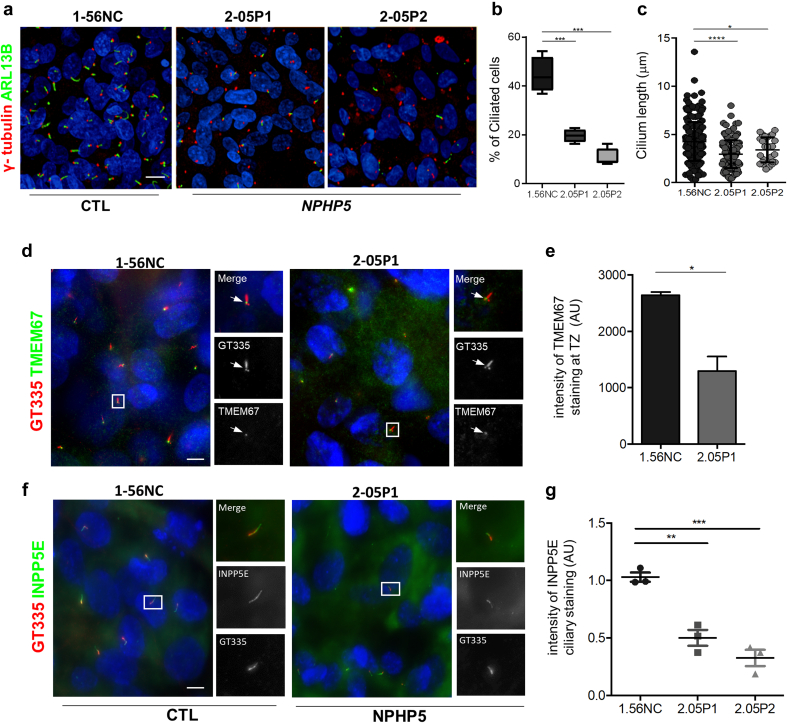
NPHP5 URECs show ciliogenesis and ciliary composition defects. (a–c) Control (1-56NC) and NPHP5 URECs (2.05P1, 2.05P2) grown in ciliogenesis conditions fixed and stained for primary cilia (ARL13B, green) and basal bodies (γ- tubulin, red) markers (a). (b) Ciliogenesis and (c) cilium length were quantified as in Figure 1. (b) n = 4 experiments; mixed linear-regression model with quasibinomial penalization: ∗∗∗P < 0.001. (c) n = 3 experiments; unpaired 2-tailed t test: ∗∗∗∗P < 0.0001; ∗P < 0.05. (d) Ciliated control (1.56.NC) and NPHP5 (2.05P1) URECs were fixed and stained for basal body and axoneme (GT335, red) and for TMEM67 (green), which is a marker of the transition zone (arrows). (e) TMEM67 staining intensity at the transition zone was quantified as detailed in Methods. n = 2 experiments; unpaired 2-tailed t test: ∗P < 0.05. (f) Ciliated control (1.56.NC) and NPHP5 (2.05P1) URECS were fixed and stained for basal body and axoneme (GT335, red) and for INPP5E (green). (g) Intensity of INPP5E staining in cilia was quantified as explained in Methods. n = 3 experiments; unpaired 2-tailed t test: ∗∗P < 0.01, ∗∗∗P < 0.001. Scale bars 10 μm. UREC, urinary renal epithelial cells.
Acknowledgments
This image is the copyrighted work of the attributed author or publisher, and
ZFIN has permission only to display this image to its users.
Additional permissions should be obtained from the applicable author or publisher of the image.
Full text @ Kidney Int Rep
Your Input Welcome
Thank you for submitting comments. Your input has been emailed to ZFIN curators who may contact you if
additional information is required.
Oops. Something went wrong. Please try again later.